-Let's Take A Look Back At November 2019-
-Market Stats-

You may be asking, what exactly do these statics mean..
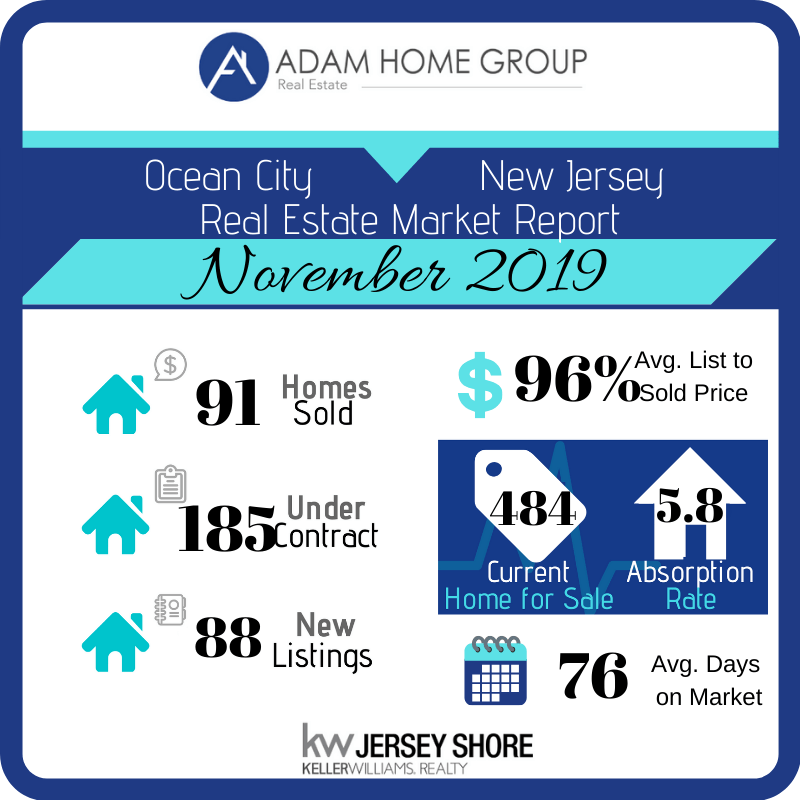
In November 2019- The Ocean City Real Estate Market Performed as follows:
From 11.1.2019- 11.30-2019, a total of 91 homes were sold.
From 11.1.2019-11.30.2019, a total of 88 homes came onto the Market.
There are Currently 484 Homes for Sale in OCNJ, and 185 Homes that are now Under Contract.
The average Home spent 76 days on the Market, from the time it was listed, to the time that it went Under Contract.
The average List price to Sold Price, means that the homes sold for 96% of their asking price.
A Absorption Rate of 5.8, means that we are currently in a Sellers Market- and it is a great time to list your home if you have been considering this!
Did you know that you can follow us on Facebook, Instagram, LinkedIn, and even Pinterest? Be Sure to Like our Page, or Follow Us to Stay Up To Date with OCNJ News and Events!
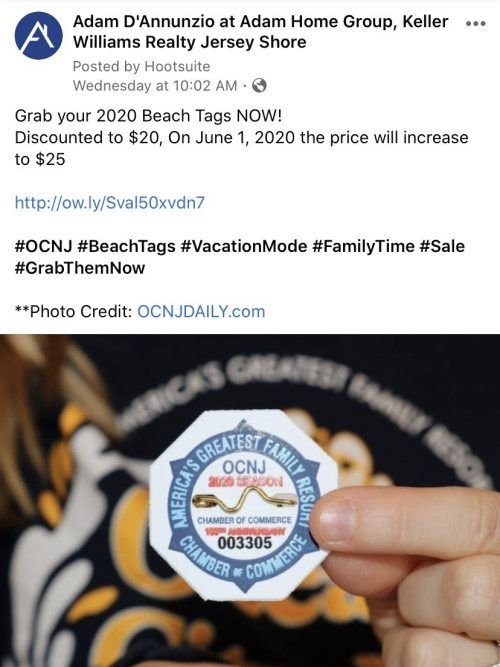
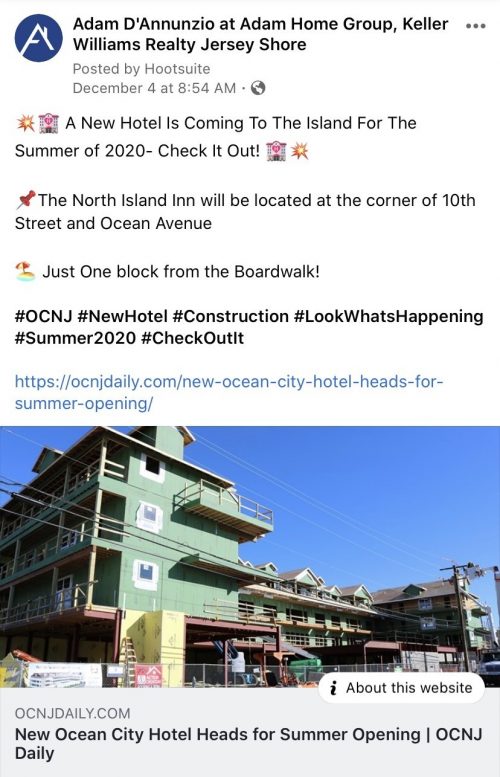
Some Recent Posts from the Last Month-


