Summary: Nationally, inventory keeps rising but at a slower clip, homes are taking longer to sell, and pricing is mostly flat. Locally across the South Jersey Shore (Atlantic & Cape May Counties), supply sits around a balanced ~4 months, demand remains active, and selling prices are still holding close to list. Below is the data you can use to price, prep, and plan your next move.
National Snapshot (Context for Local Decisions)
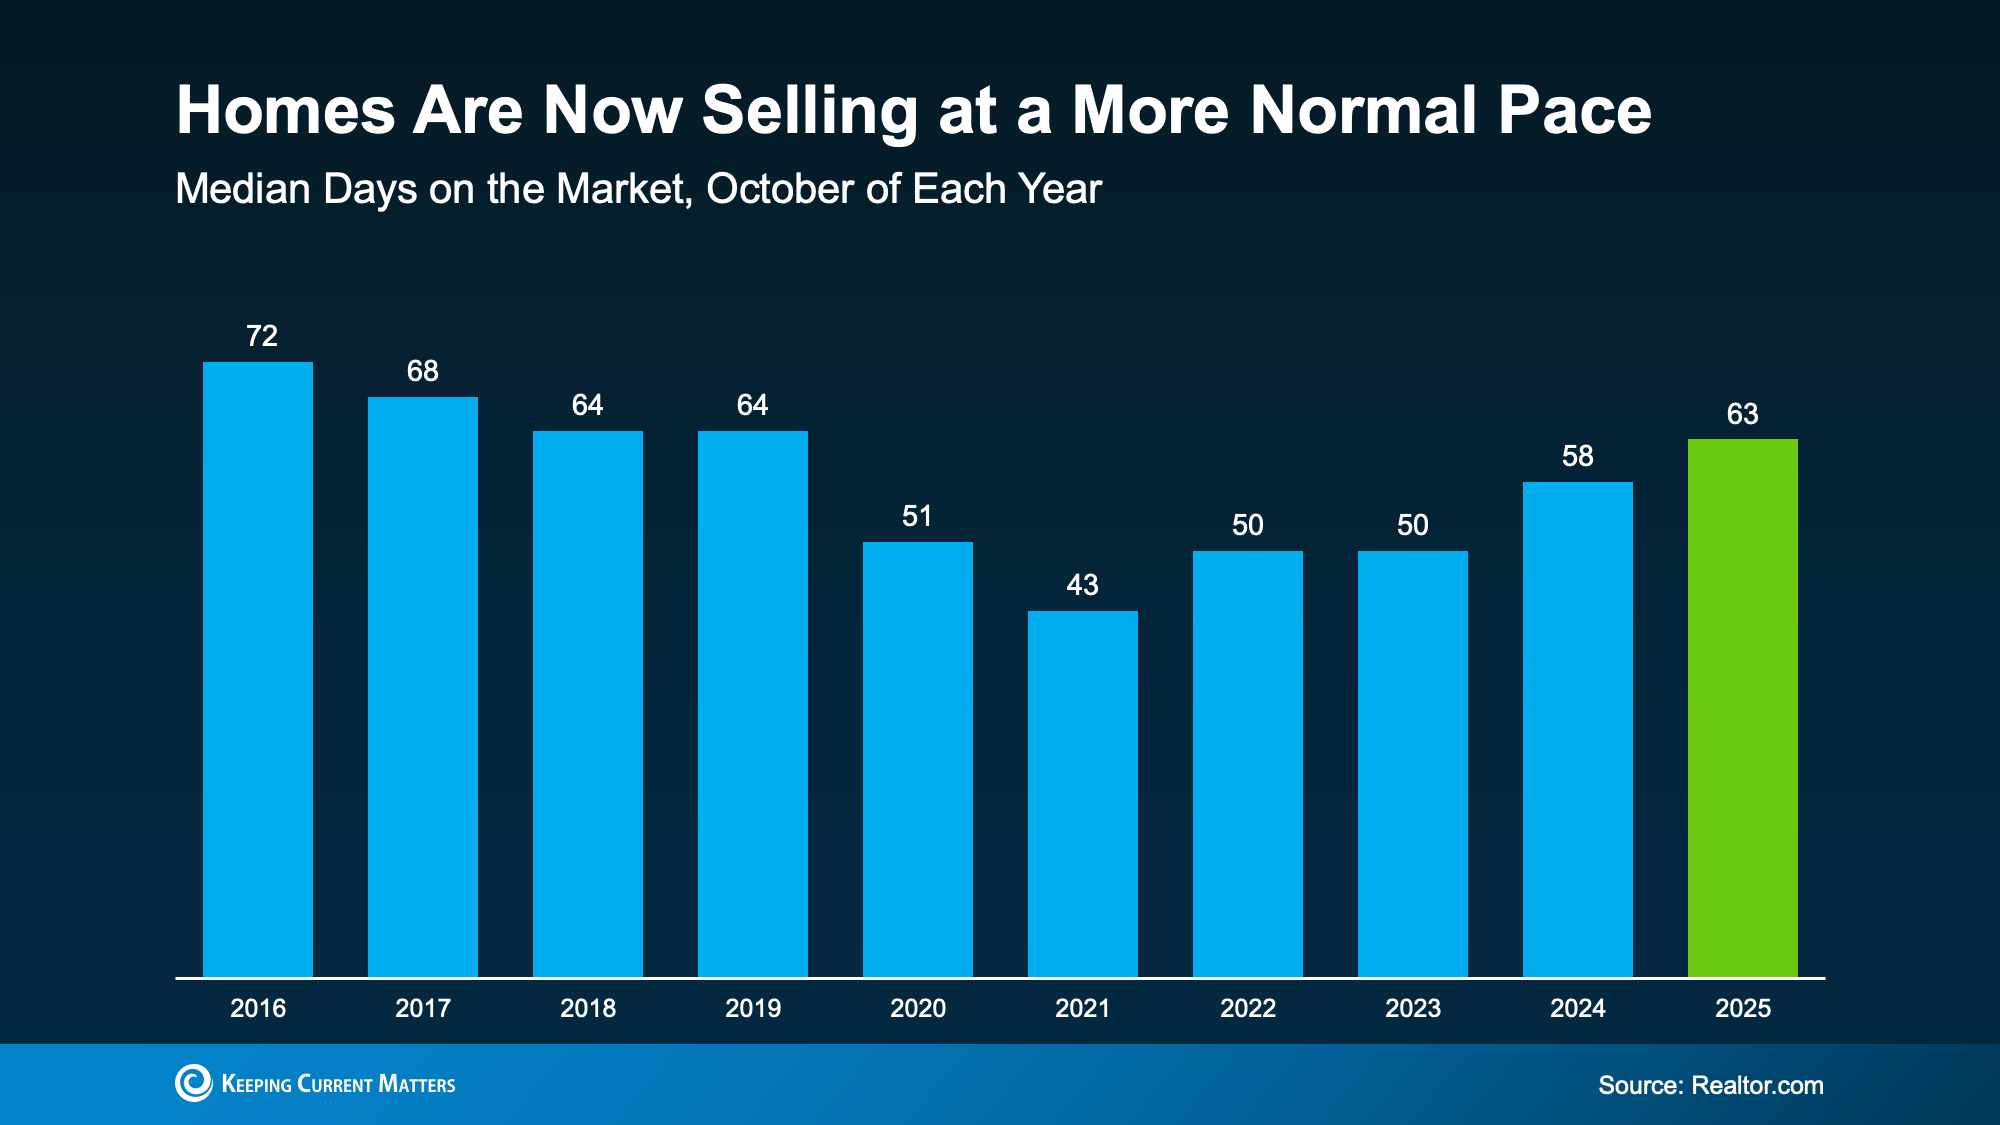
- Inventory up, growth slowing: Active listings continued to rise year over year, while the pace of growth has cooled since spring. Homes spent roughly two months on market nationally, and the national median list price was little changed year over year.
- Regional mix: Inventory growth is strongest in the West and South, more modest in the Northeast and Midwest; relative to pre-pandemic, the Northeast still runs tighter.
- Price reductions & outlook: Roughly one in five listings saw a price cut this fall; leading forecasts point to slight national appreciation into 2026.
- Policy wildcard – shutdown & coastal risk: The prolonged federal shutdown has delayed portions of housing activity and disrupted issuance of new NFIP flood policies (renewals generally have a short grace period). Expect some temporary drags in affected metros until operations normalize.
South Jersey Shore (Atlantic & Cape May): Where We Stand
Market type: Both counties are operating near a balanced zone with roughly ~4 months of supply:
- Atlantic County: ~3.8 months of supply; median sold price around $410,000; median ~21 days to sell; sold-to-list ~97.7%.
- Cape May County: ~4.0 months of supply; median sold price around $875,000; median ~26 days to sell; sold-to-list ~97.5%.
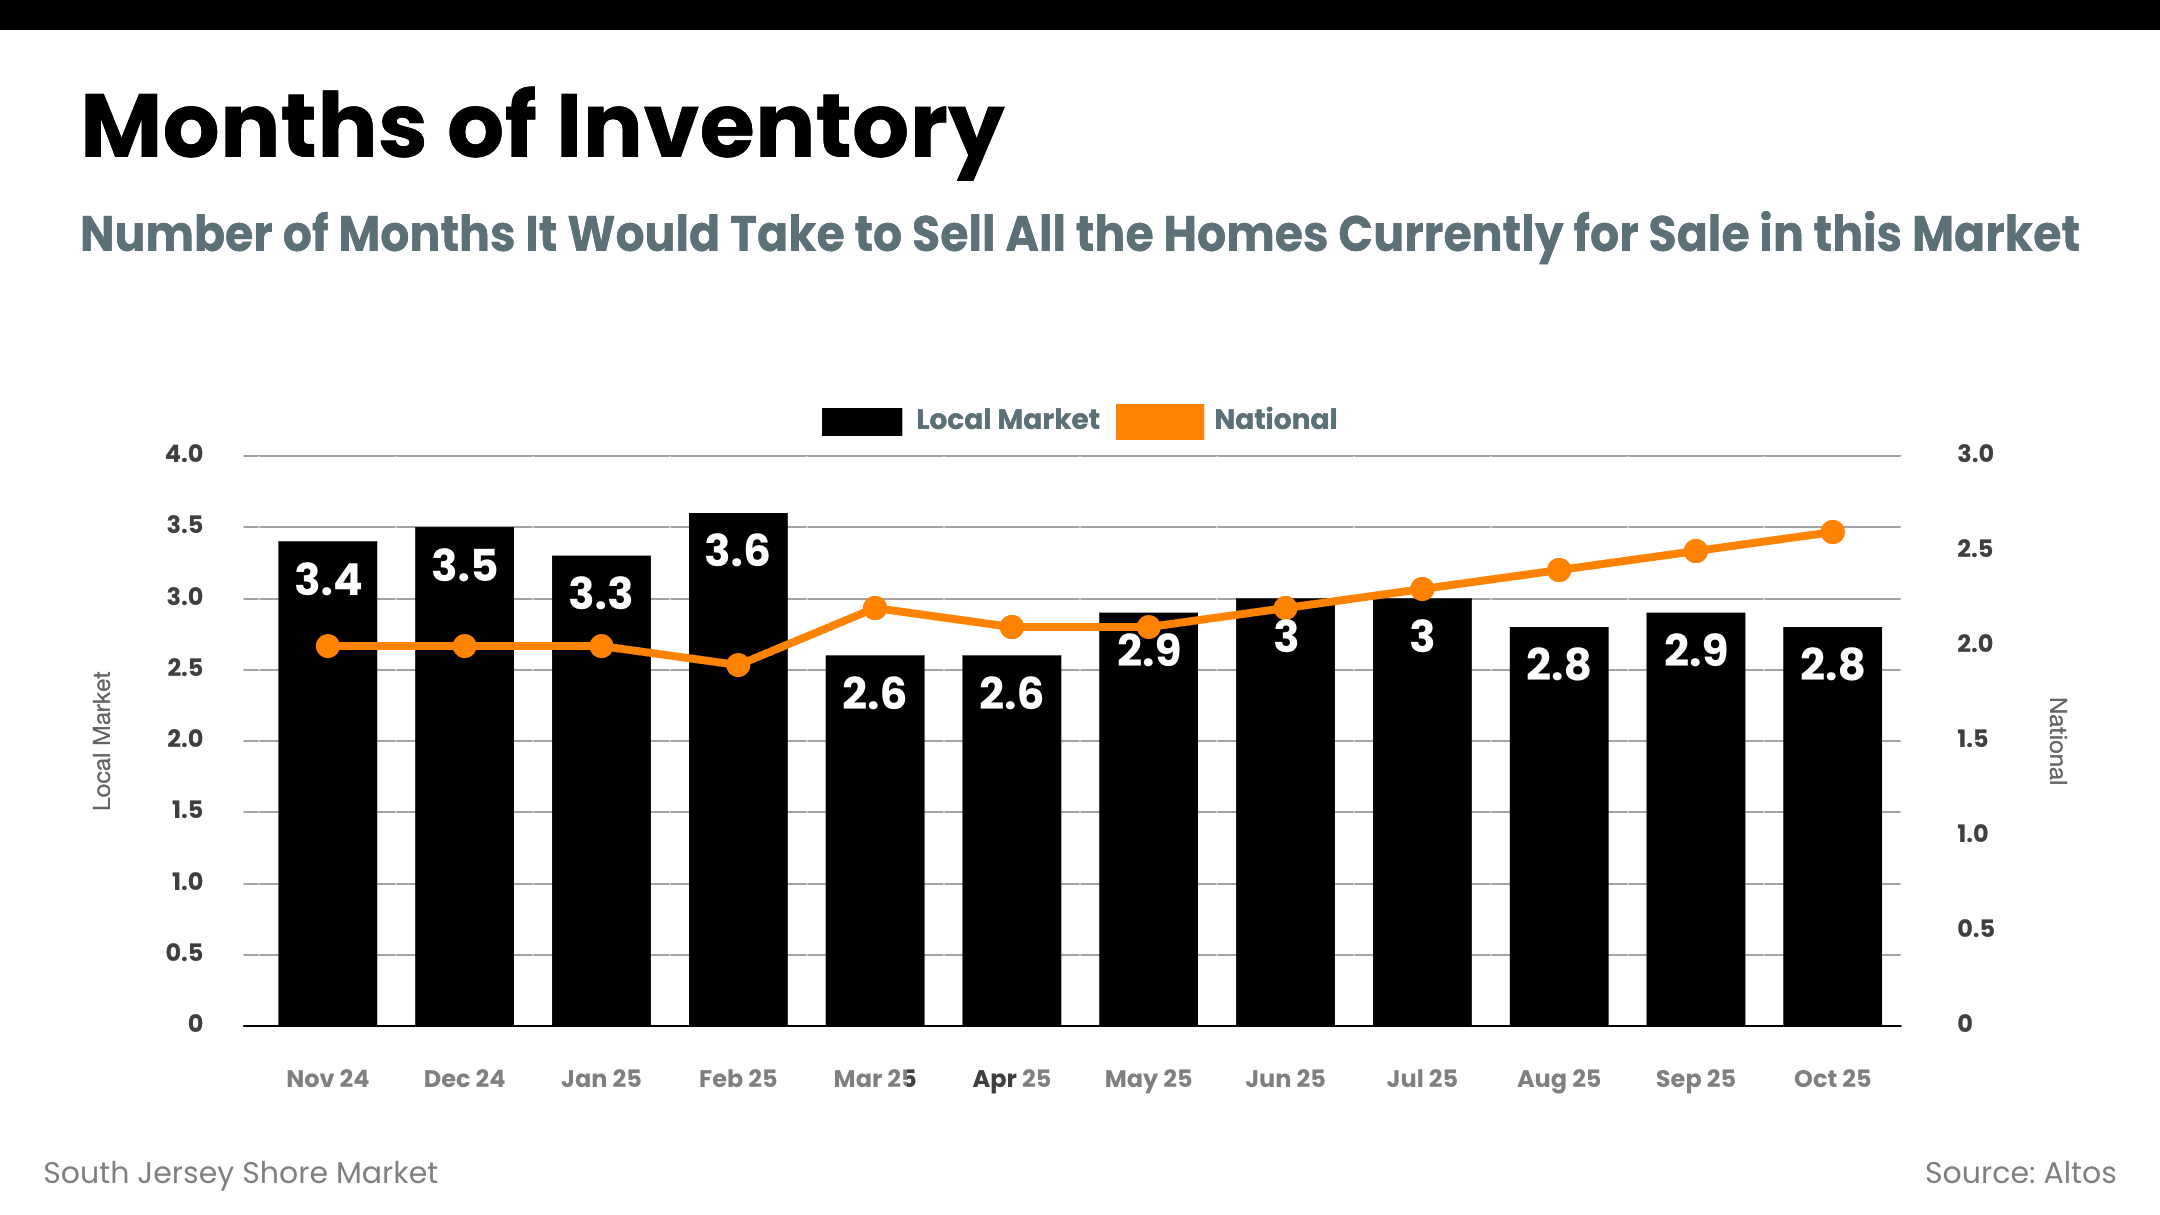
Inventory & New Supply
- Atlantic County: ~1,300 active listings (median list near $425,000; median DOM ~63). New listings ~500 (median list near $417,000).
- Cape May County: ~1,000 active listings (median list near $749,000; median DOM ~55). New listings ~415 (median list near $749,000).
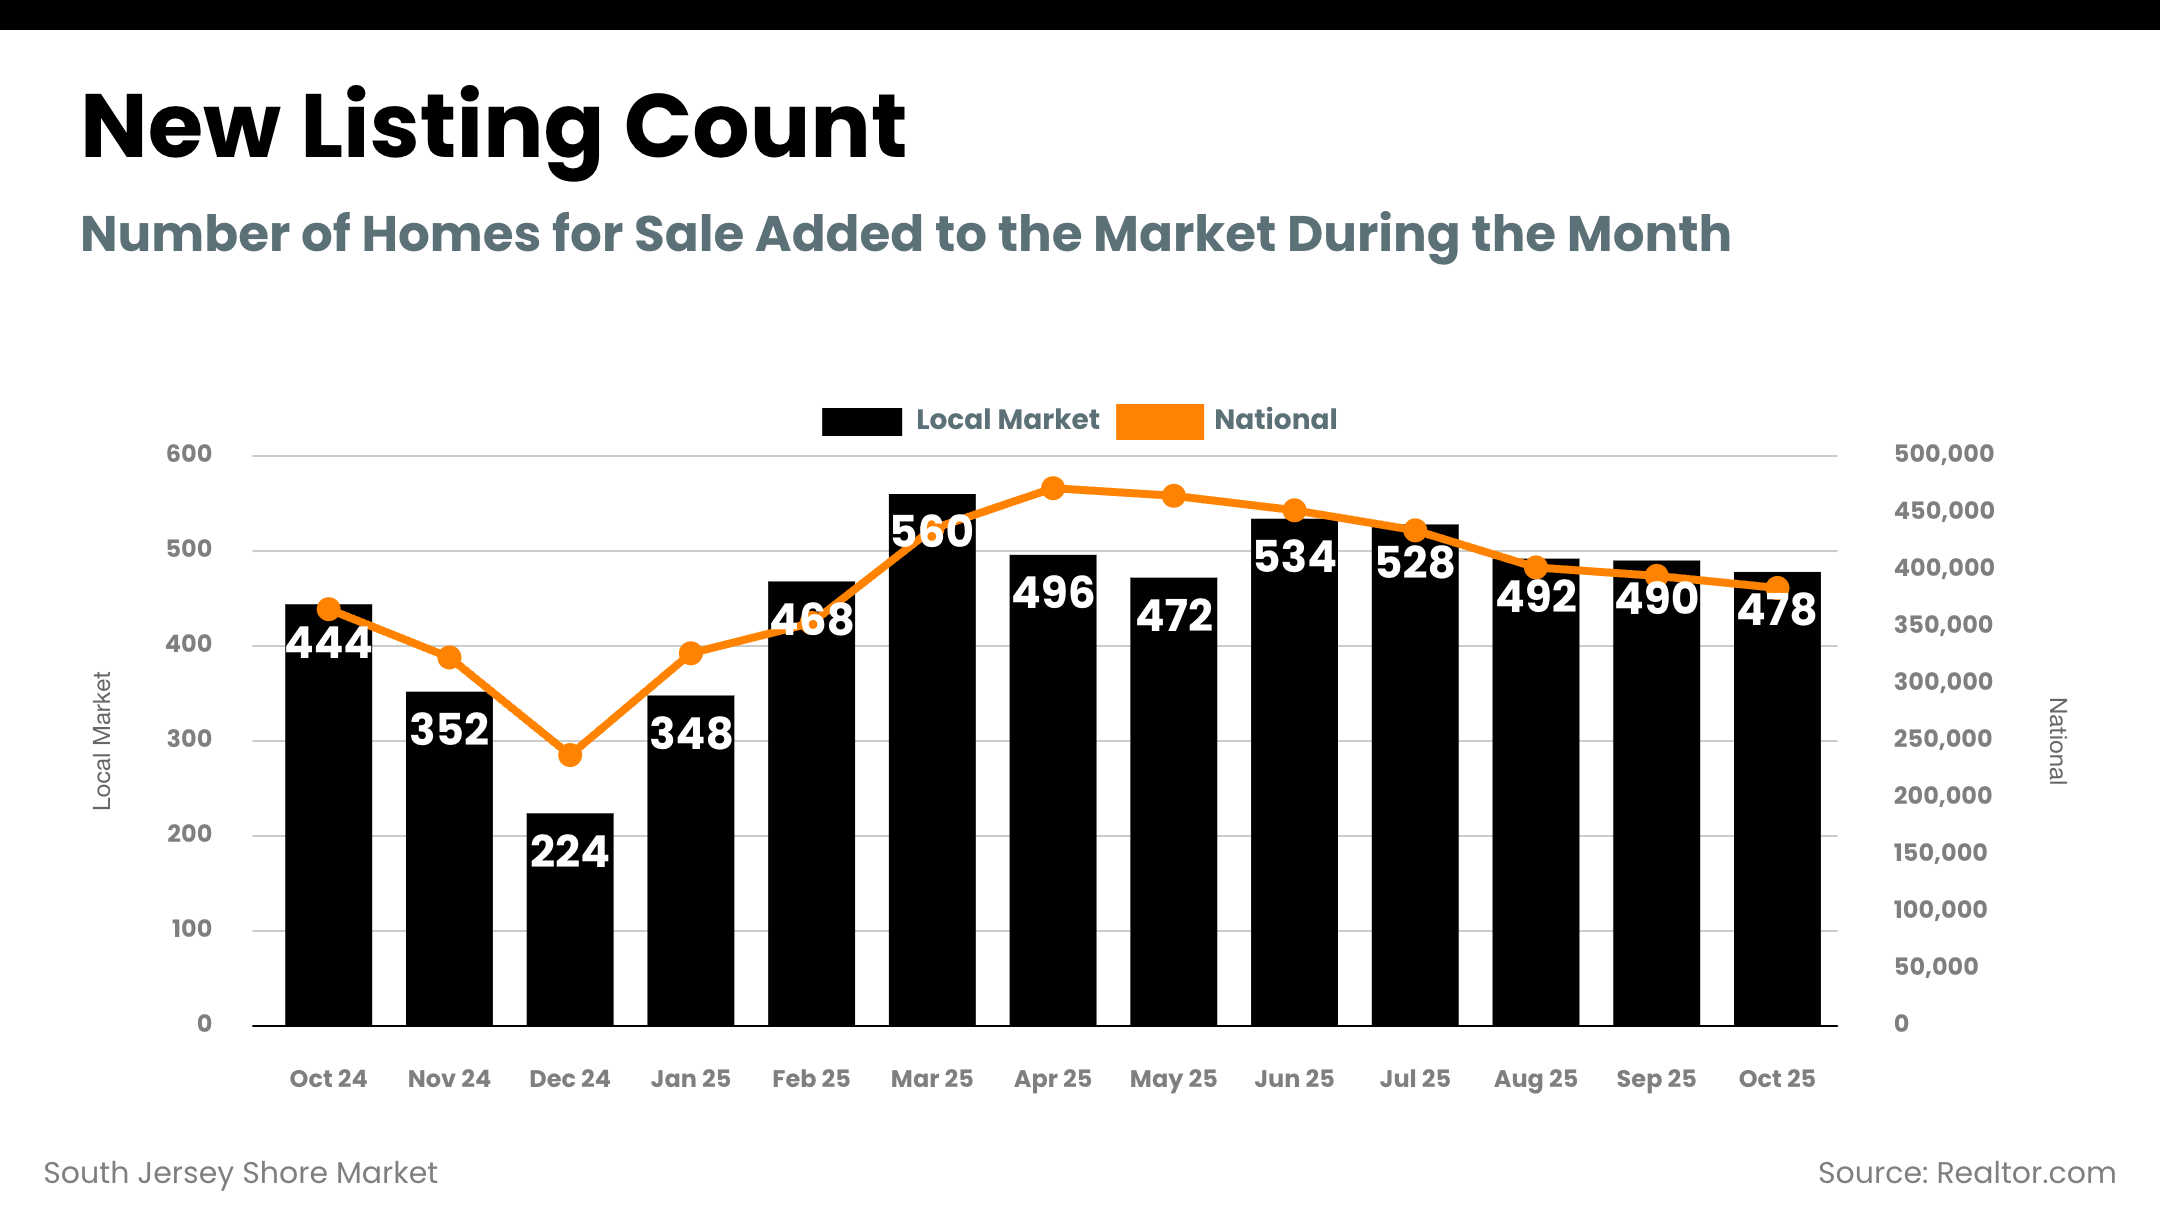
Demand Pulse (Pending & Days on Market)
- Atlantic County pendings: ~330 under contract; median list at contract ~ $385,000; median ~29 days to go pending.
- Cape May County pendings: ~250 under contract; median list at contract ~ $739,000; median ~28 days to go pending.
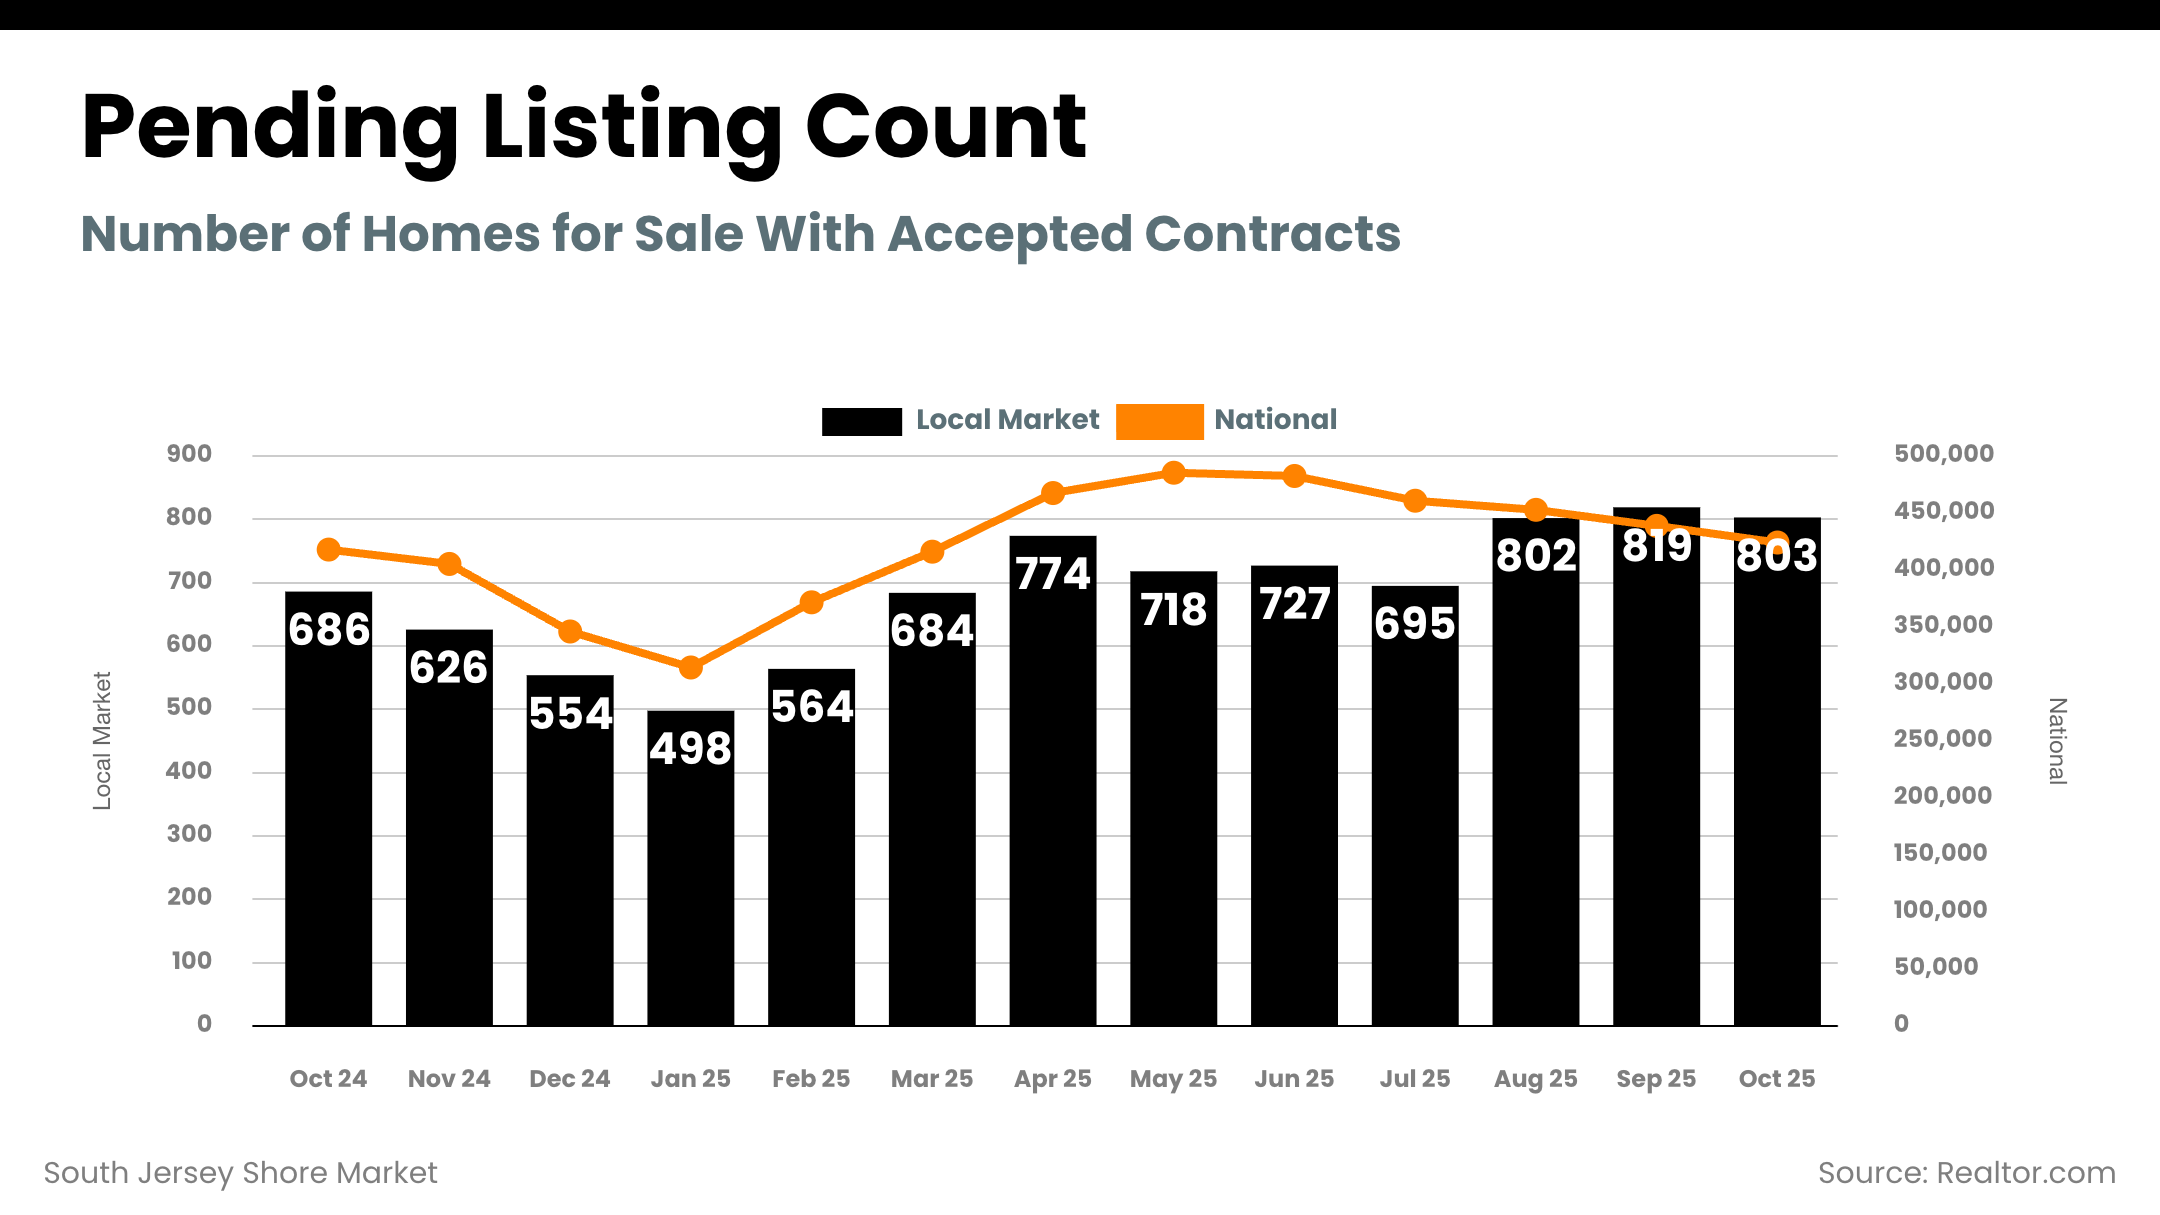
Closed Prices & Pricing Power
- Atlantic County closings (Oct): median sold near $410,000; ~21 median days; sold-to-list ~97.7%.
- Cape May County closings (Oct): median sold near $875,000; ~26 median days; sold-to-list ~97.5%.
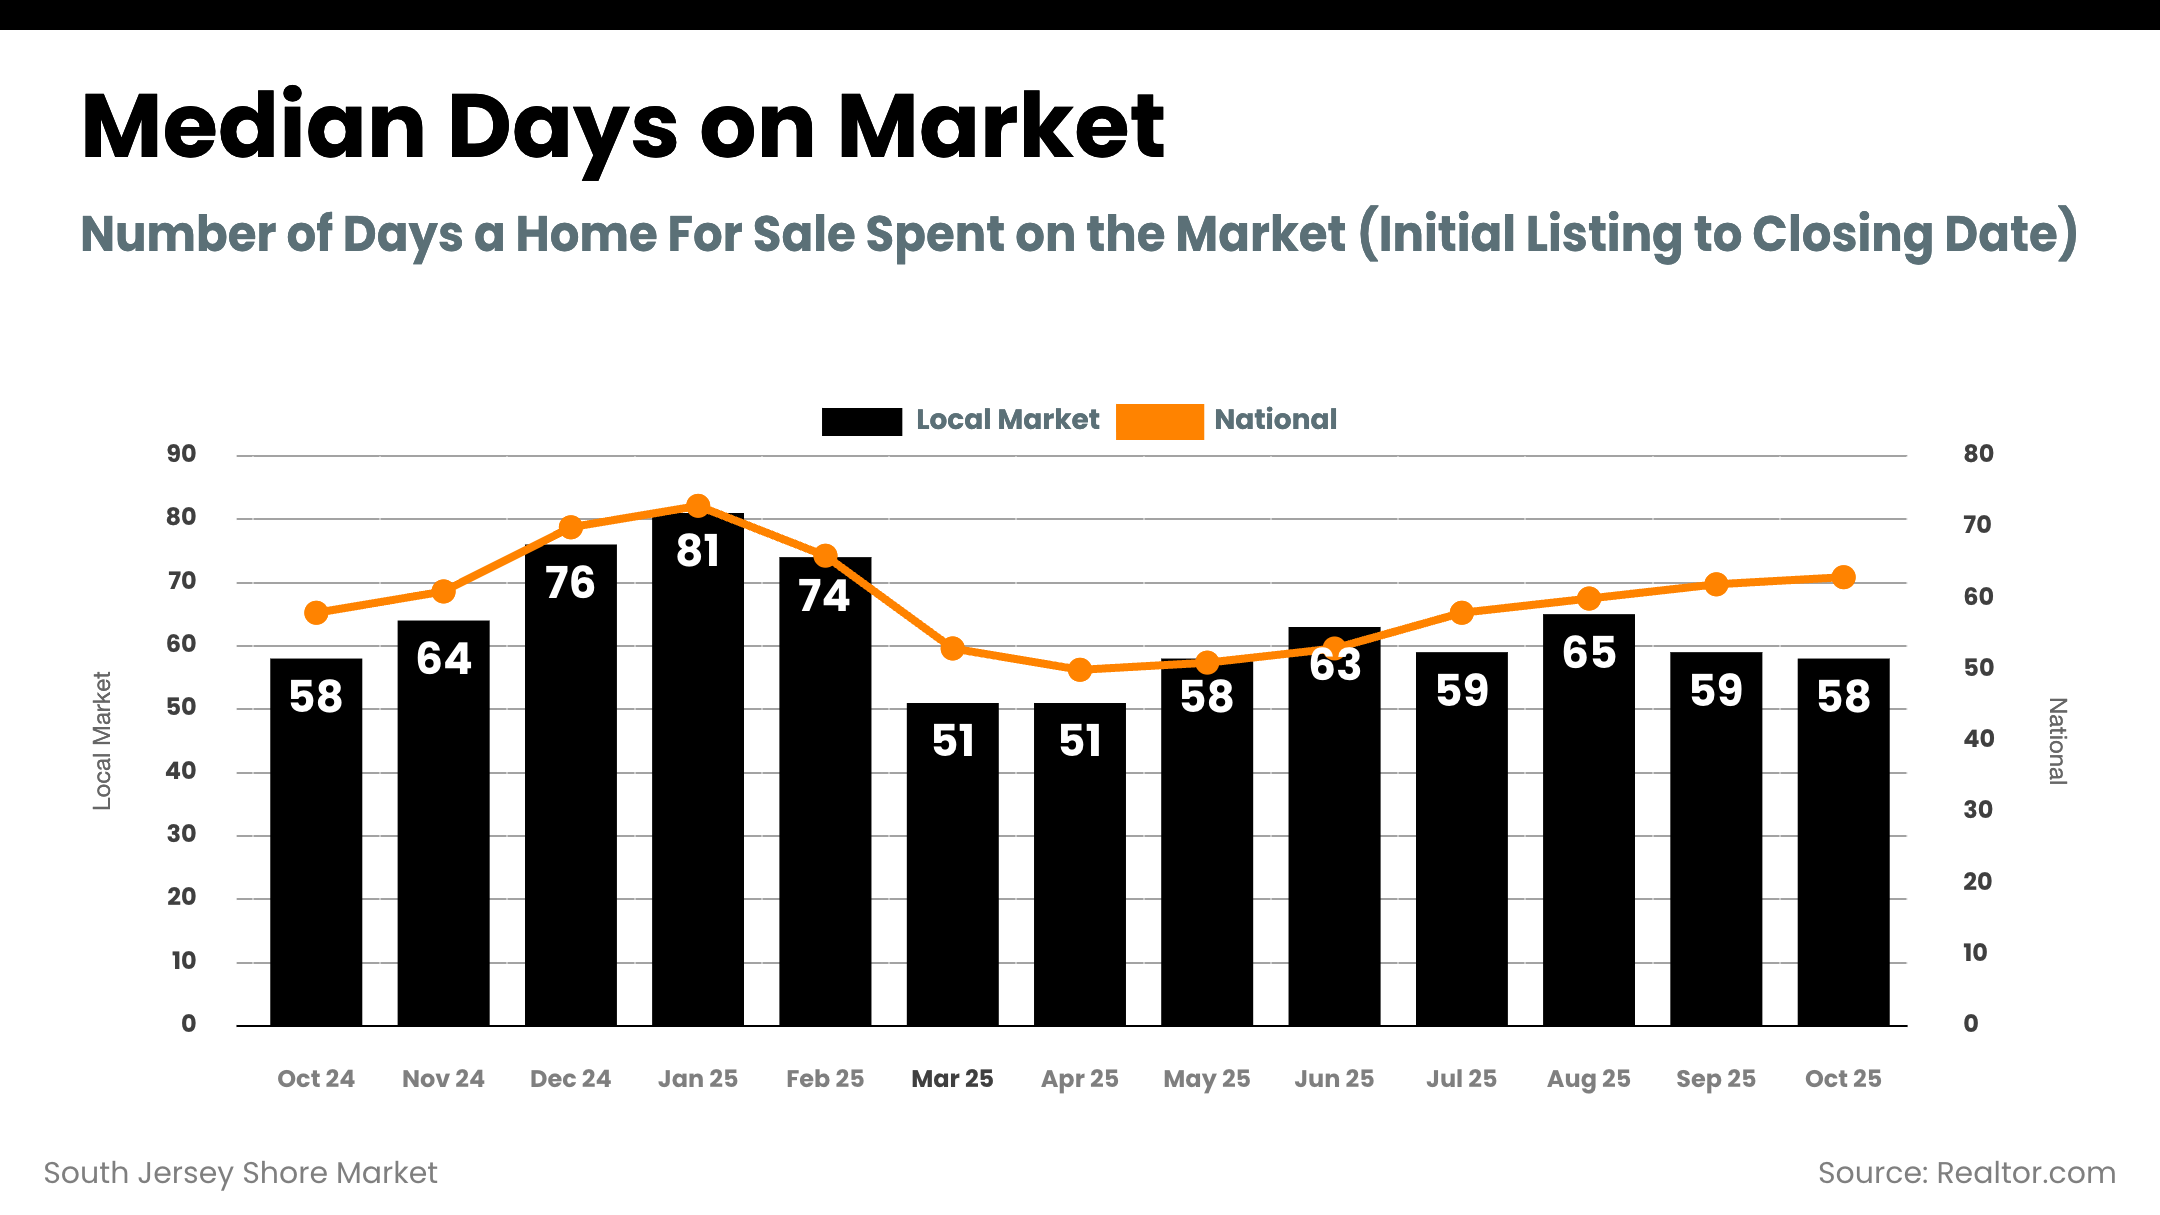
How Our Local Data Fits the U.S. Picture
The Shore’s ~4 months of supply and high-90s sold-to-list ratios echo the national cooling-but-not-crashing theme. Nationally, buyers have more leverage than a year ago, but the leverage shift is uneven by region—and the Northeast remains comparatively tighter than the South and West.
Expect more negotiation (condition, credits, pricing precision) rather than deep price capitulation. Price reductions have re-entered the conversation nationally, but most forecasts still call for modest national price gains into 2026.
Mortgage Rates & Affordability: Why This Matters at the Shore
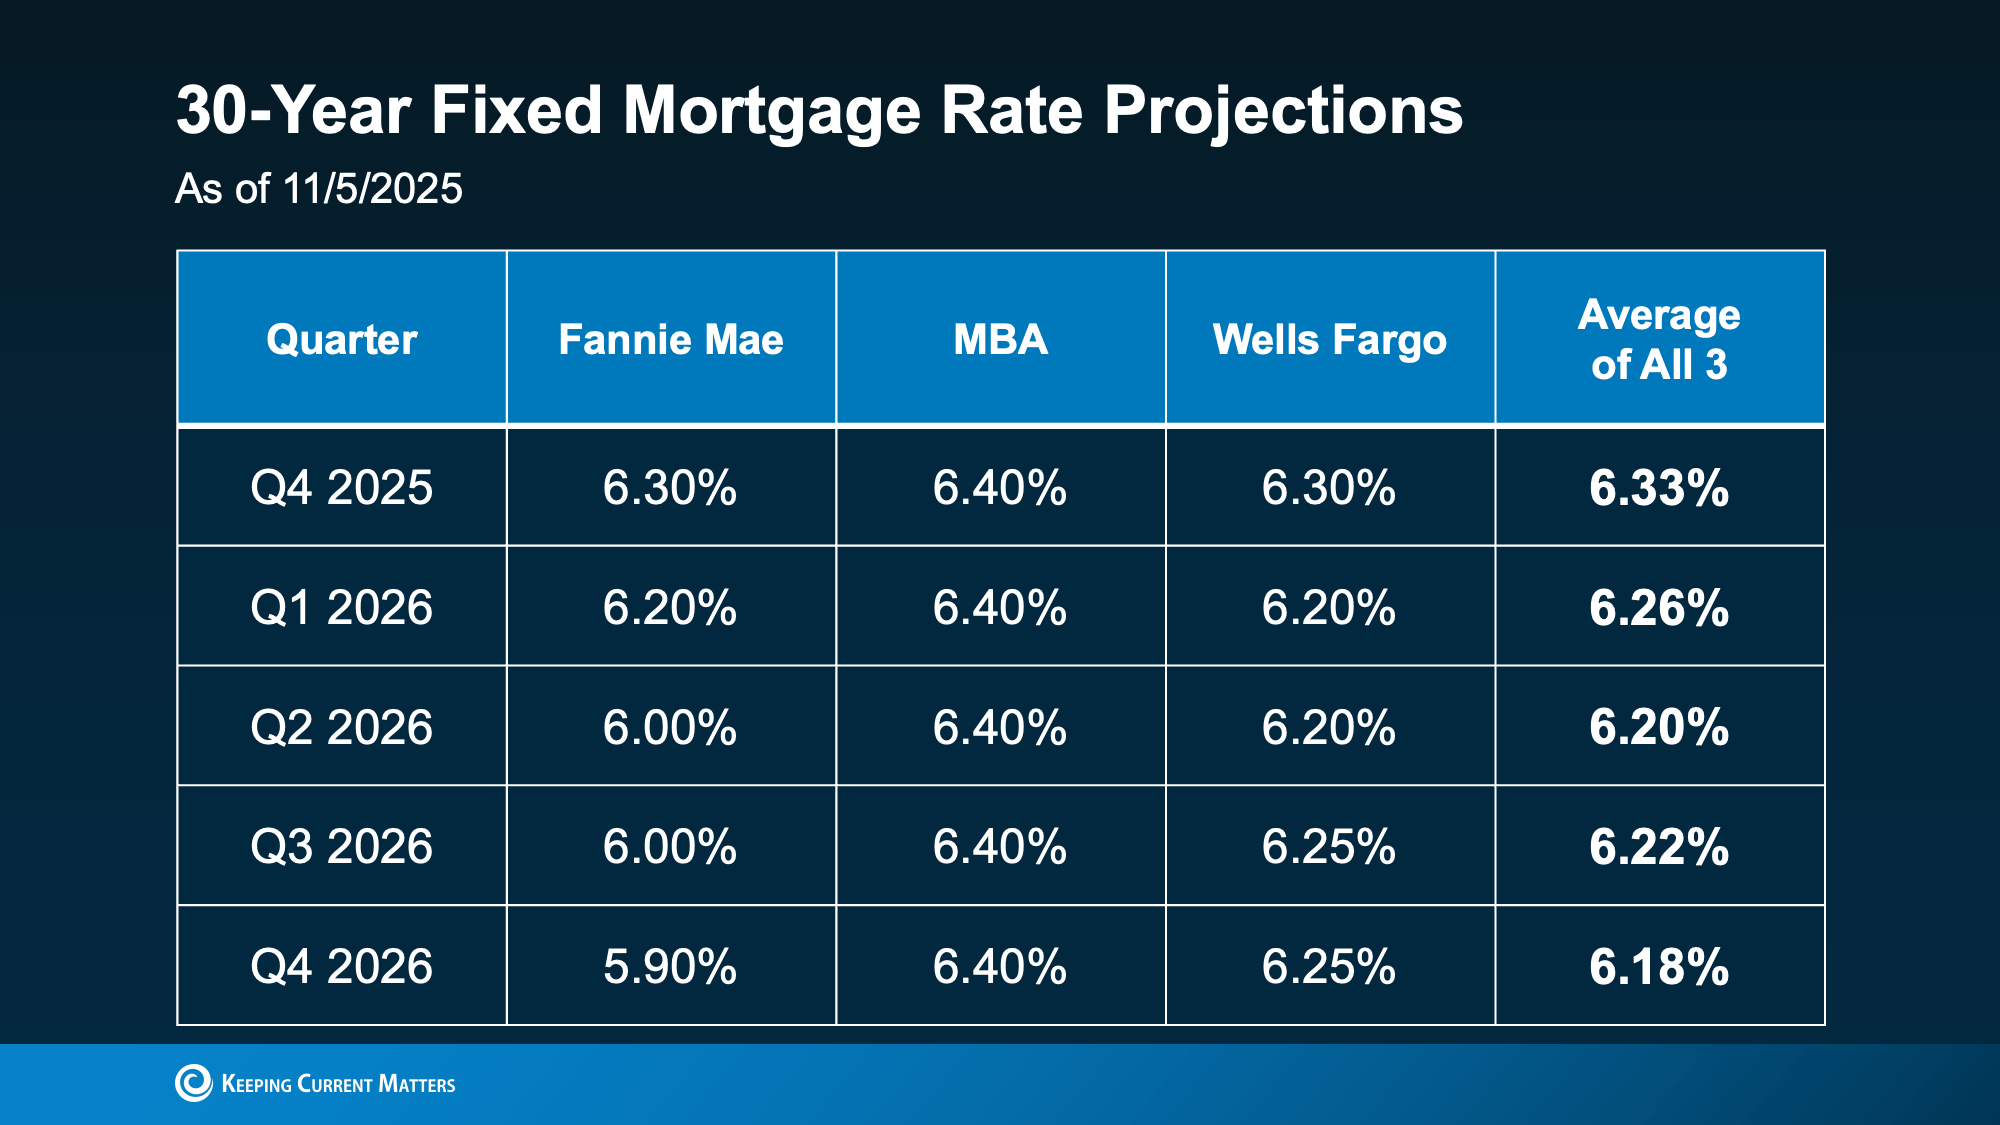
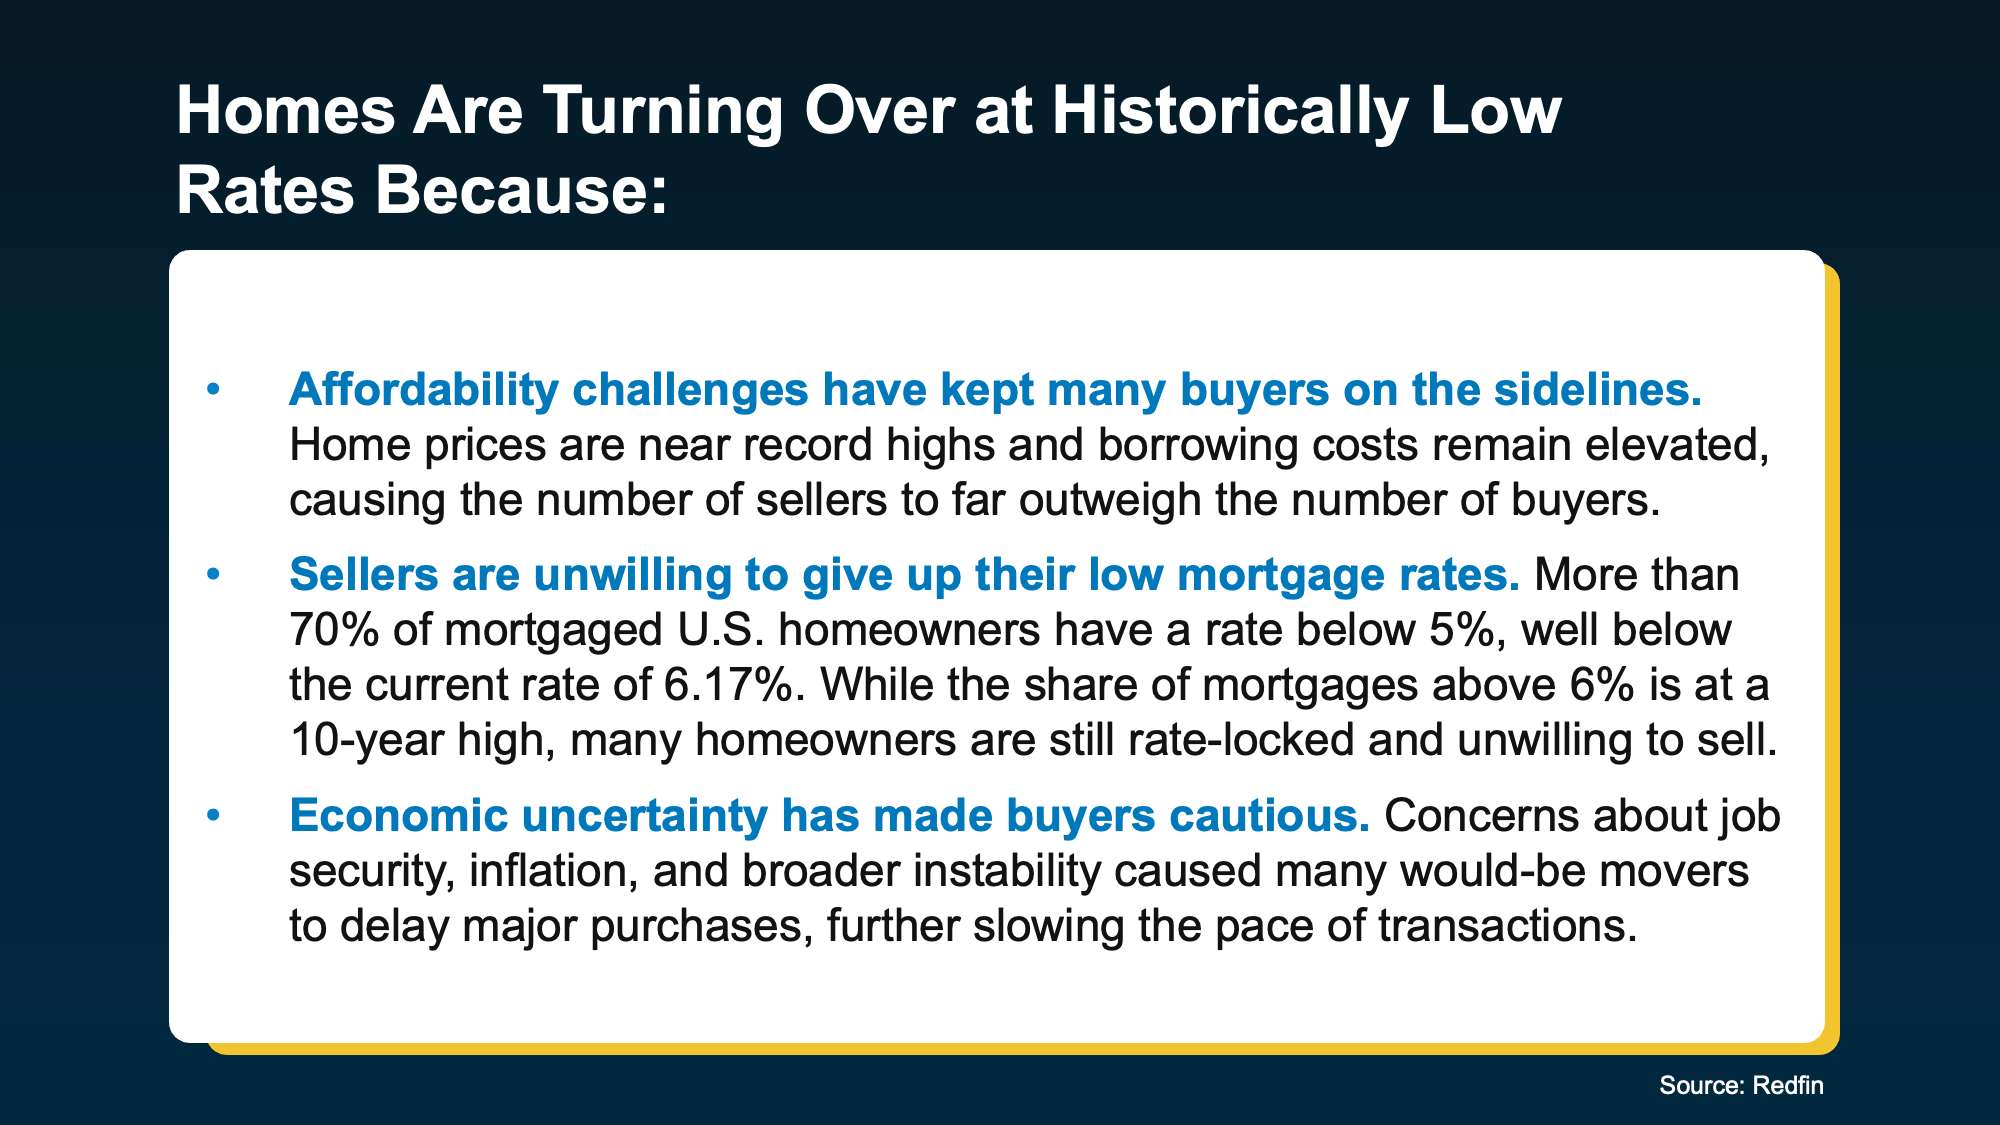
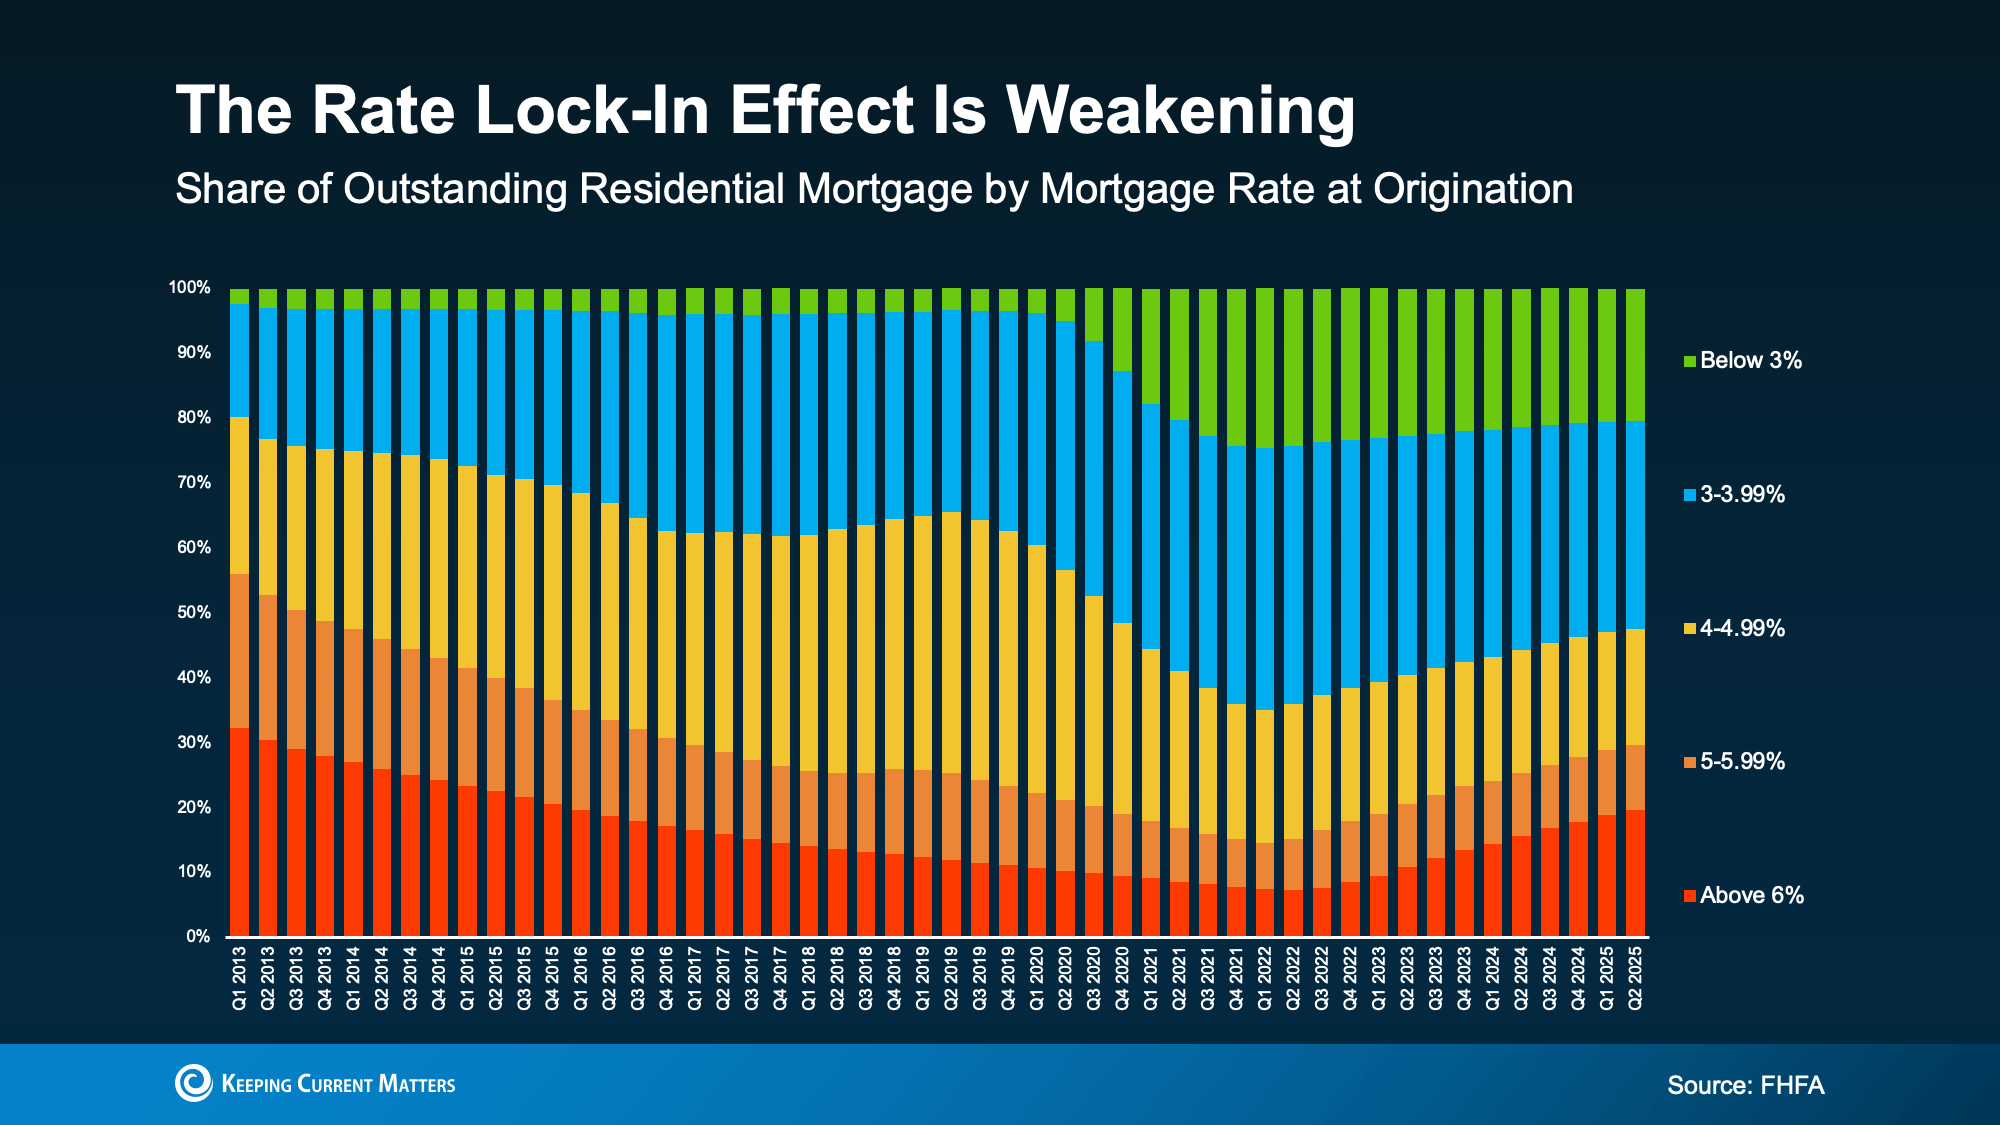
Lower rates versus the peaks have improved monthly payments, helping unlock move-up/move-down decisions even as inventory normalizes. National time-on-market has moved back toward pre-pandemic norms.
Actionable Guidance
If You’re Selling (Atlantic or Cape May)
- Price to today’s comps, not last spring’s headlines. With ~4 months of supply and more price cuts nationally, the first two weeks are critical—optimize list price and condition to avoid chasing the market.
- Lean on presentation: High-end Cape May segments still move quickly when staged and turnkey; Atlantic entry-to-mid price points see strongest throughput under ~$450k.
- Expect qualified negotiation, not fire-sale bids. With sold-to-list near 98% in both counties, clean offers with reasonable terms win; prep for inspection/credit requests rather than major price haircuts.
If You’re Buying
- Act decisively on well-priced homes. Median contract times around 28–29 days mean attractive listings still draw quick attention, especially in turnkey Shore locations.
- Use choice to your advantage. Active listings are elevated versus a year ago, giving you room to compare neighborhoods, condition, and flood risk thoroughly.
- Mind the policy backdrop if you need flood insurance. If new NFIP policies are delayed, factor timing into contract contingencies and insurance quotes.
Local & National Visuals

Bottom Line for November 2025
The South Jersey Shore sits in a normalized, negotiable market with approximately four months of supply and high-90s sale-to-list performance. Smart pricing, standout presentation, and clean terms are the levers that still produce quick, strong outcomes—even as national conditions slow and policy headlines swirl.
Have questions about your street or building?
I track these numbers weekly for Atlantic and Cape May. If you’d like a custom pricing strategy, absorption analysis, or a “buy/sell same-time” game plan tailored to your address and timeline, reach out and I’ll build it for you.
Local Area Specific Market Reports (these reports are updated every 48 hours)