


1. National Backdrop: A Normalizing Market, Not a Crash
The national housing market is closing out 2025 in a very different place than the frenzied 2020–2022 era. The dominant themes today are more inventory, more time on market, and slowly improving affordability, but not a full-blown buyer’s market.
- Inventory: Active listings have now risen year-over-year for 25 straight months, up about 12.6% vs. last year.
- Total homes for sale: The number of homes on the market has stayed above 1 million for seven consecutive months, still about 11.7% below typical 2017–2019 levels.
- National list prices: The national median list price is $415,000, down a modest 0.4% year-over-year.
- Days on market: The typical U.S. listing spent about 64 days on the market in November, which is a slight increase vs. last year but roughly back to pre-pandemic norms.
- Price cuts: About 18% of U.S. listings now show a price reduction, and in October that figure peaked near 20.2%, with regional shares ranging from about 14.5% in the Northeast to over 21% in the South and West.
In other words, nationally we are in a cooler, more deliberate market, not the overheating of a few years ago. That context matters when we zoom into the South Jersey Shore.
2. Mortgage Rates & 2026 Outlook
Mortgage rates are the main story behind today’s market and the 2026 outlook.
2.1 Where rates are today
- On December 10, 2025 the Federal Reserve cut its policy rate by 0.25%.
- Mortgage rates actually improved after the Fed announcement, not because of the cut itself but because markets liked the tone of Fed Chair Jerome Powell’s press conference (more evidence of cooling inflation and hints that rates are now in the “high range of neutral”).
- As of mid-December, the Freddie Mac 30-year fixed rate sits around 6.22%, near the lowest level in more than a year and far below the 7%+ levels seen earlier in 2025.
2.2 Where rates are headed in 2026
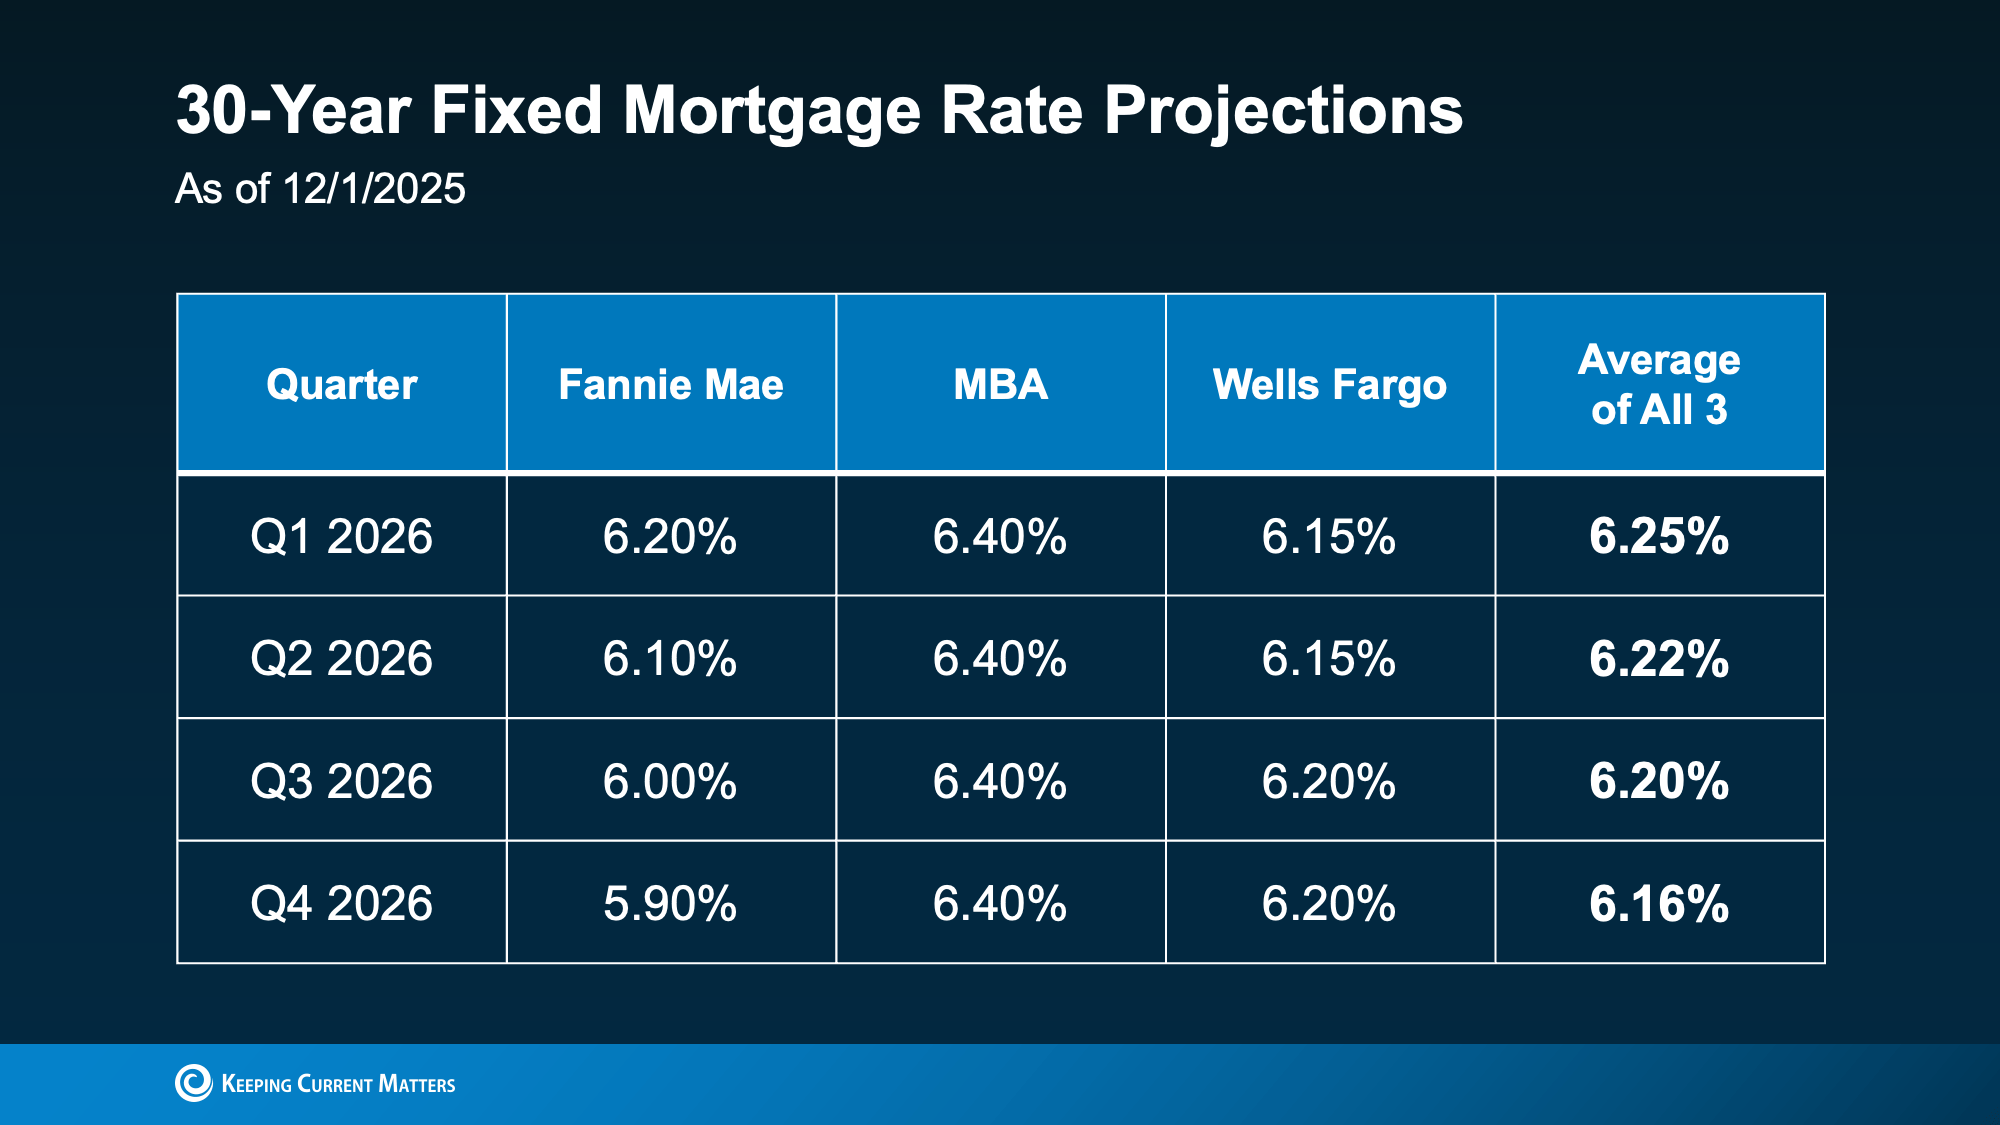
A consensus of major forecasters (Fannie Mae, MBA, Wells Fargo) expects 30-year mortgage rates to hover in the low-6% range throughout 2026:
- Q1 2026: Average projection around 6.25%
- Q2 2026: Around 6.22%
- Q3 2026: Around 6.20%
- Q4 2026: Around 6.16%
The National Association of Realtors (NAR) expects that if rates settle near 6%:
- Existing home sales could increase by roughly 14% in 2026.
- Roughly 5.5 million additional households could qualify to buy, including about 1.6 million renters who have been priced out until now.
Put simply, national experts see 2026 as a year of gradual recovery and renewed opportunity, not a boom and not a bust.
3. South Jersey Shore Overview: Atlantic & Cape May Counties Combined
The South Jersey Shore market, combining Atlantic County and Cape May County, doesn’t move in lockstep with the national averages. It is a coastal, lifestyle-driven market, and the data shows a market that is still short on supply and high on demand, especially for well-located shore properties.
3.1 Months of Inventory: Still a Seller-Leaning Market
A combined view of Atlantic and Cape May Counties shows months of inventory staying consistently under 4 months throughout the past year:
- Local inventory fluctuated from about 3.6 months in February 2025 down to around 2.6 months in March and April.
- Through the prime selling season (late spring through fall), inventory held in a tight band near 2.8–3.0 months.
- By November 2025, the South Jersey Shore market sat at roughly 2.9 months of inventory, compared with about 3.3 months nationally.
A balanced market is typically considered to be around 5–6 months of inventory, so the South Jersey Shore remains a clear seller-leaning environment, with tighter supply than the U.S. overall.
3.2 New Listings: Seasonal Drop, Still Active Market
New listing activity across the South Jersey Shore followed a classic seasonal pattern over the last 12 months:
- November 2024: Roughly 352 new listings.
- Winter 2024–25: New listings dipped to around 224 in December 2024, then rebounded to 348 in January 2025.
- Spring peak: New listings surged to about 560 in March 2025, with strong follow-through at 496 (April) and 472 (May).
- Summer activity: New listings stayed robust in the 492–534 range from June through August.
- Fall & early winter 2025: New listings tapered as expected, with around 478 in October and 332 in November 2025.
November 2025’s 332 new listings is slightly below the 352 in November 2024, reinforcing the story of a market that is active but still relatively tight on fresh inventory.
3.3 Pending Listings: Demand Remains Solid
Pending contracts are a direct window into buyer demand. Across the South Jersey Shore:
- November 2024: About 626 pending listings.
- Early 2025: Pending contracts dipped seasonally to around 554 in December 2024 and 498 in January 2025, then climbed to 564 in February.
- Spring & summer push: Pendings rose strongly during the selling season, peaking between about 684 and 774 in March and April, and remaining high through the summer.
- Late-season high: Pending listings reached roughly 802 in August and about 819 in September 2025, showing very strong late-summer buyer activity.
- Most recent reading: As of November 2025, pendings stood near 710, higher than November 2024’s 626.
The combination of slightly fewer new listings but more homes going under contract year-over-year points to steady to strengthening demand at the shore, even as many national markets have cooled.
3.4 Days on Market: Faster Than National
For the South Jersey Shore as a whole, the median days on market for listings over the past year look like this:
- Winter peak: About 76 days in December 2024 and around 81 days in January 2025.
- Spring acceleration: Days on market dropped sharply to 74 days in February and then to about 51 days in March and April.
- Summer & fall: DOM drifted modestly higher into the high-50s and low-60s through late summer and early fall.
- November 2025: Median days on market settled at about 64 days locally, compared with roughly 71 days nationally in the same period.
So, even using the broader listing metric, the South Jersey Shore is selling about a week faster than the U.S. average.
4. County-Level Deep Dive: Cape May vs. Atlantic
4.1 Cape May County: High-Price Coastal Market, Tightening Supply
For November 2025 (single family + condo / townhouse / apartment):
- Median sold price: $715,000, an 18% decrease month-over-month, but still well above national price levels.
- Median active list price: $799,000.
- Months supply of inventory: 3.84 months, down 6% vs. last month and 13% vs. last year.
- Speed of transactions (sold listings): Median of 22 days in the RPR system, a 15% decrease from last month.
- Market scale: About 984 active listings, with new pending listings showing a median of 38 days in RPR.
Cape May County remains very much a premium coastal market:
- Prices are significantly higher than the U.S. median list price of $415,000.
- Inventory has tightened over the last year instead of loosening.
- Well-priced homes can go under contract in just a few weeks.
The month-to-month drop in median sold price is best viewed as a mix shift (fewer ultra-luxury closings in the sample) rather than a sign that values are collapsing. Demand remains strong for Victorian architecture, walkable shore towns, and beach-adjacent properties.
4.2 Atlantic County: More Negotiation Room, Still Attractive For Buyers
For November 2025 (single family + condo / townhouse / apartment):
- Median active list price: $405,000.
- Median sold price: $399,000, a 3% month-over-month decline.
- Months supply of inventory: 3.79 months, up 4% vs. last month.
- Speed of transactions (sold listings): Median of 26 days in RPR for closed sales, a 13% increase in days on market compared with the prior month.
- Sold-to-list price ratio: About 96.76%, down about 1%, indicating slightly more buyer leverage.
Atlantic County is closer to national price points but still offers diverse opportunities:
- Median sold price near $399,000 puts it right around the national median list price.
- Inventory has ticked up modestly, creating a bit more choice for buyers.
- The small drop in the sold-to-list ratio shows that negotiation is back on the table, especially for homes that start out overpriced.
With attractions like Atlantic City’s boardwalk and the region’s coastal amenities, Atlantic County is still highly desirable, but it currently offers more flexibility for buyers than many high-priced coastal markets elsewhere in the U.S.
5. How South Jersey Shore Compares To The U.S. Market
5.1 Inventory & Supply
- U.S. overall: Inventory is rebuilding but still below pre-pandemic levels, with price cuts becoming more normal.
- South Jersey Shore: Combined Atlantic + Cape May inventory is under 4 months and in Cape May specifically, supply has declined 13% year-over-year.
Result: The local market is tighter—and more competitive—than the national average, especially on the Cape May side.
5.2 Pricing
- National: Median list price of $415,000, essentially flat year-over-year.
- Cape May County: Median sold price of $715,000 (down sharply month-over-month but still at a high level) and active median list price of $799,000.
- Atlantic County: Median sold price of $399,000, right around the national median and below Cape May’s premium pricing.
Result: The South Jersey Shore is a two-tier market: Cape May trades as a high-end coastal destination, while Atlantic County offers comparatively more affordable options.
5.3 Days on Market
- National listings: About 64 days on market in November.
- South Jersey Shore listings: About 64 days on market locally vs. 71 days nationally in the same chart, meaning the area is selling roughly a week faster than the U.S. as a whole.
- Closed sales (RPR): Even faster: 22 days in Cape May County and 26 days in Atlantic County for sold properties.
Result: Properly priced homes at the South Jersey Shore still move quickly, especially relative to many parts of the country where buyers are more hesitant.
5.4 Price Reductions & Regional Trends
Nationally, price reductions have become more common. By October 2025:
- About 20.2% of U.S. listings had a price reduction.
- The Northeast remained the tightest region, with only about 14.5% of listings showing cuts.
- Other regions (Midwest, South, West) were closer to or above 20%.
As the South Jersey Shore sits within the inventory-squeezed Northeast, local sellers are under less pressure to cut prices than in many Southern and Western markets, but strategic pricing is still critical.
6. What This Means For Buyers
For buyers in Atlantic and Cape May Counties, the data tells a story of opportunity plus urgency:
- Rates have improved but are not “cheap”: The low-6% range creates more manageable payments than 7%+ rates, but affordability is still a real challenge.
- Inventory is better than a year ago in many national markets, but still tight locally: Months of inventory under 4 means you cannot assume unlimited choices or big discounts at the shore.
- Days on market are relatively short: You may still have to move quickly when a well-priced home hits your criteria, especially in Cape May County.
- Atlantic County offers more room to negotiate: With a 96.76% sold-to-list ratio and slightly higher inventory, there is more flexibility here than in many coastal markets.
Buyer tips for late 2025 and early 2026
- Get fully pre-approved, not just pre-qualified. In a tight-inventory, mid-to-high price coastal market, sellers still favor buyers who can show strong financing upfront.
- Budget using current rate forecasts. Plan around rates in the low-6% range for 2026; any meaningful drop from there is a bonus, not a guarantee.
- Compare both counties. Consider Atlantic County for more affordability and Cape May County for long-term lifestyle and appreciation potential.
- Think long term wealth, not just next year’s payment. National data continues to show that homeownership is one of the most reliable ways to build wealth over time compared with renting.
7. What This Means For Sellers
Sellers at the South Jersey Shore are still in a relatively strong position, but the strategy has changed from the peak years.
- You still have the supply advantage. Months of inventory under 4 and sub-30-day RPR timelines for closed sales remain seller-friendly.
- Overpricing is punished more quickly. With 18–20% of national listings seeing price cuts, buyers are more sensitive to value and more willing to wait or walk away.
- Atlantic County sellers must be strategic. Slightly longer days on market and a sold-to-list ratio below 97% mean buyers are negotiating again.
- Cape May County sellers benefit from scarcity. Tightening inventory and fast sales times keep well-priced homes in high demand, even with recent median price volatility.
Seller tips for late 2025 and early 2026
- Price with precision. Use hyper-local comps (same town, similar property type, similar distance to the beach) rather than leaning on national headlines.
- Present your home at its best. In a market where buyers have more options than during 2021–2022, condition, staging, and marketing matter again.
- Plan around real timelines. Even with strong demand, expect roughly 20–30 days to secure a strong contract on a properly priced home, plus the usual time for inspections, appraisal, and closing.
- Coordinate buy/sell moves carefully. With RPR data showing different timing patterns between new pending listings and sold listings, close coordination is key if you are both selling and buying in the region.
8. Looking Ahead: 2026 Opportunities At The South Jersey Shore
Pulling all the data together, the outlook for 2026 at the South Jersey Shore is one of measured improvement and continued demand:
- NAR projects a 14% increase in existing home sales nationally as rates stabilize and more buyers regain purchasing power.
- Major forecasts keep mortgage rates in the low-6% range, supportive of incremental affordability gains rather than a sudden surge.
- The South Jersey Shore remains a high-demand coastal region with below-balanced inventory, quick selling timelines, and strong lifestyle appeal.
For buyers, that means 2026 is likely to offer more options than the peak years, but still not a “wait them out” mentality, especially in the most desirable shore communities. For sellers, it means you can still sell from a position of strength, provided you align your expectations with real-time local data rather than yesterday’s headlines.
Local Area Specific Market Reports (these reports are updated every 48 hours)