This January 2026 market update looks back at the latest available full-month data (December 2025) and what it signals for early 2026. I cover the national U.S. housing backdrop first, then drill down into our local South Jersey Shore market (Atlantic County + Cape May County, NJ).
U.S. Housing Market Snapshot (December 2025): More Inventory, Softer Demand, Prices Mostly Flat
Nationally, December closed out a slow and uneven year: inventory continued to improve, while buyer demand stayed soft. Active listings rose for the 26th straight month (+12.1% year over year), even though inventory fell seasonally month over month in December (-8.9%). Homes also took longer to sell (+4 days year over year), and the national median list price was down 0.6% from a year ago.
The December pricing detail reinforces the “flat-to-slightly-down” national headline: the national median list price was $399,950 in December, down 0.6% year over year (and down 3.6% month over month).
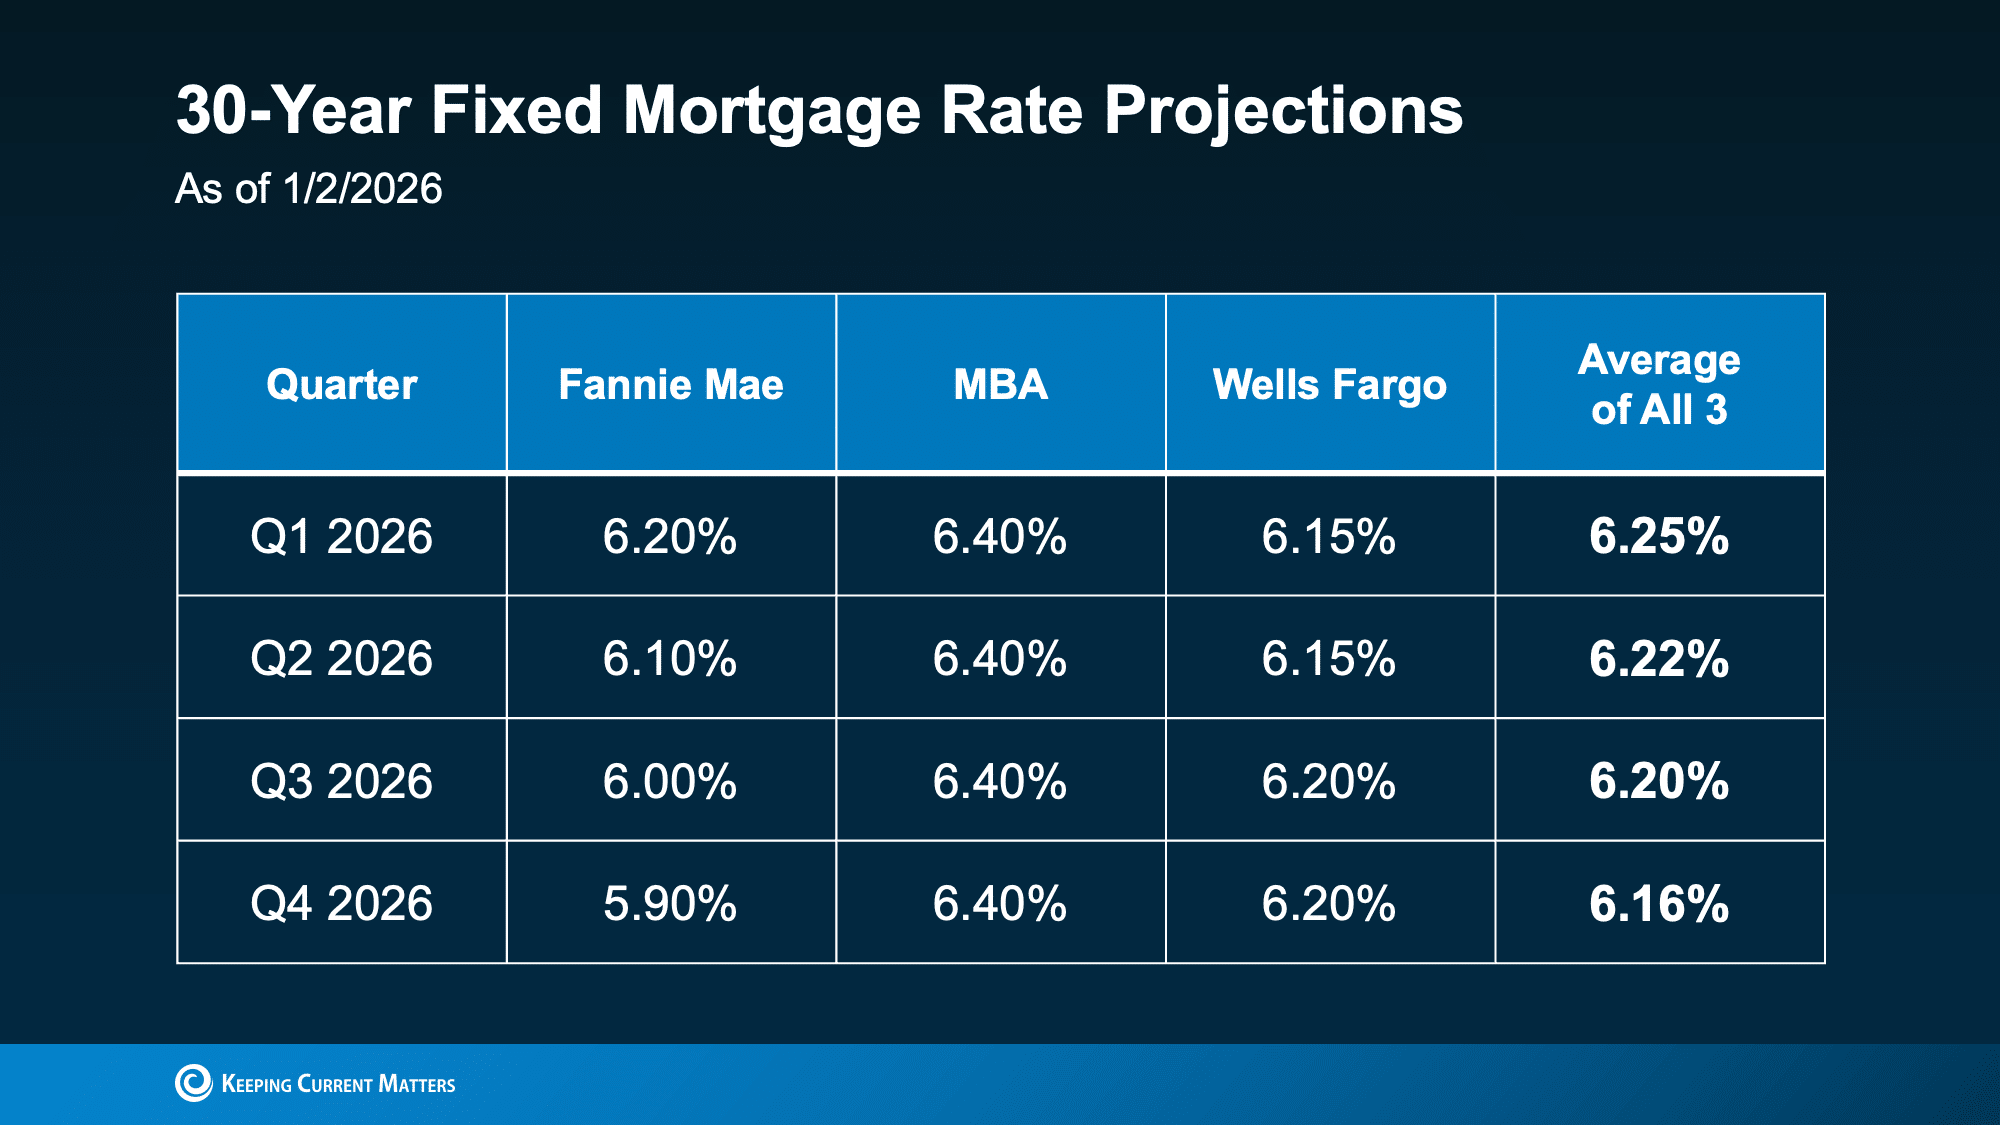
Mortgage Rates and Affordability: Why January Started With Big Rate Headlines
A major January talking point was mortgage-rate volatility tied to bond-market moves. Mortgage rate coverage noted lenders issued their best rate sheets since early 2023 after news of $200B in additional GSE mortgage-backed securities (MBS) buying, while also emphasizing that volatility remained high and some lenders moved rates back up intraday.
On the policy side, the $200B MBS-buying announcement was framed as a mechanism that can increase demand for mortgage bonds, potentially pushing yields down and putting downward pressure on mortgage rates, at least in the short term.
Why the job market still matters to housing in 2026
December’s jobs commentary described a “low-hire, low-fire” economy: payroll growth came in at 50,000, the unemployment rate fell to 4.4% (4.38% unrounded), and average hourly earnings were up 3.8% year over year. The practical housing takeaway is that labor stability and wage growth support demand, even when rate cuts are uncertain.
2026 Outlook Themes: Modest Price Growth, Better Inventory, and a More Balanced Market
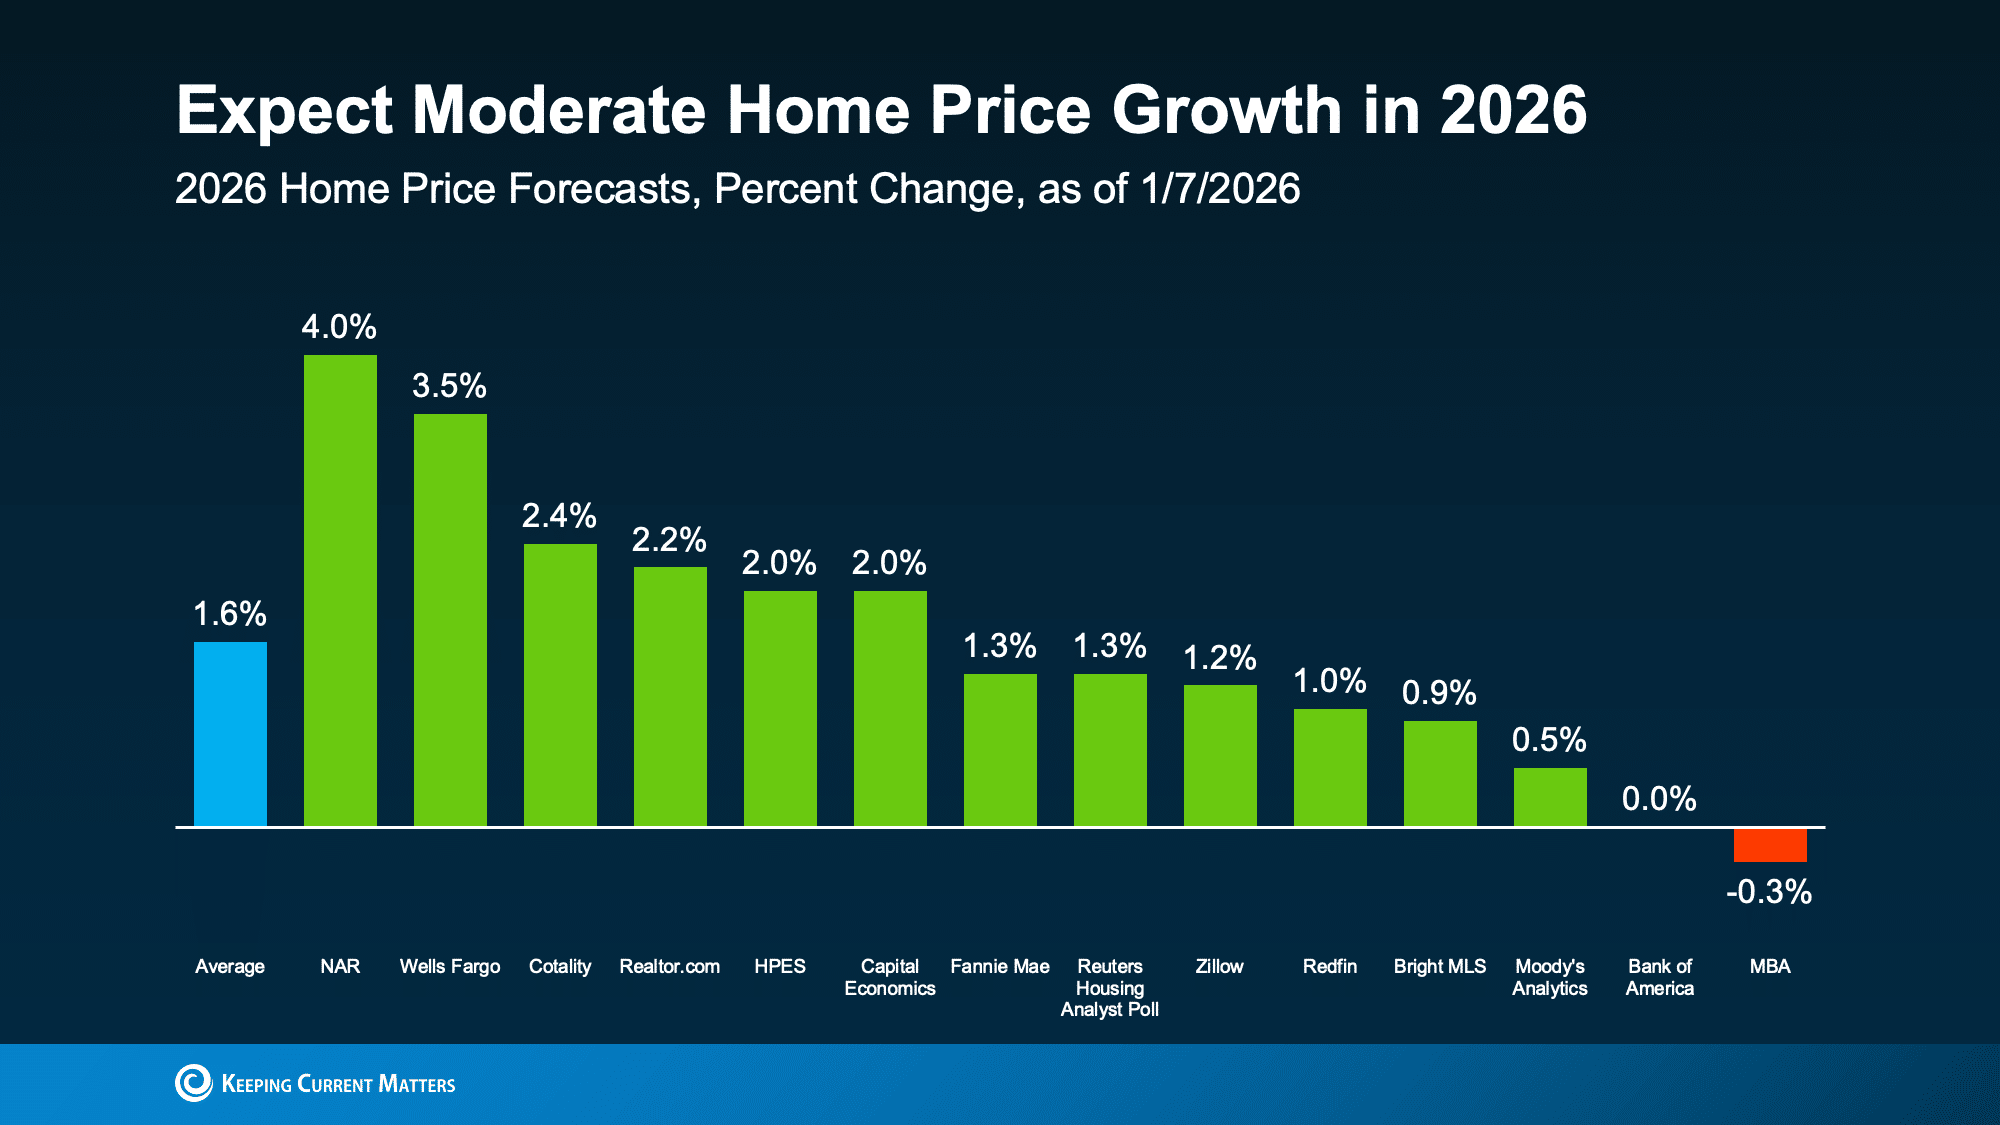
Looking ahead, the dominant theme across forecasts is “steadier,” not “boom.” Many projections call for modest national home price growth in 2026, often clustered in the low single digits. That matters because it shifts the market away from runaway appreciation and toward a more normal environment where negotiation and strategy matter again.
One 2026 outlook expects national home sales to increase about 14% in 2026 and characterizes home price growth as minimal (roughly 2% to 3%).
That same outlook emphasizes that mortgage rates are a major “unlock.” A 1 percentage-point drop in mortgage rates can materially expand the pool of households who can qualify to buy, with a portion translating into incremental sales.
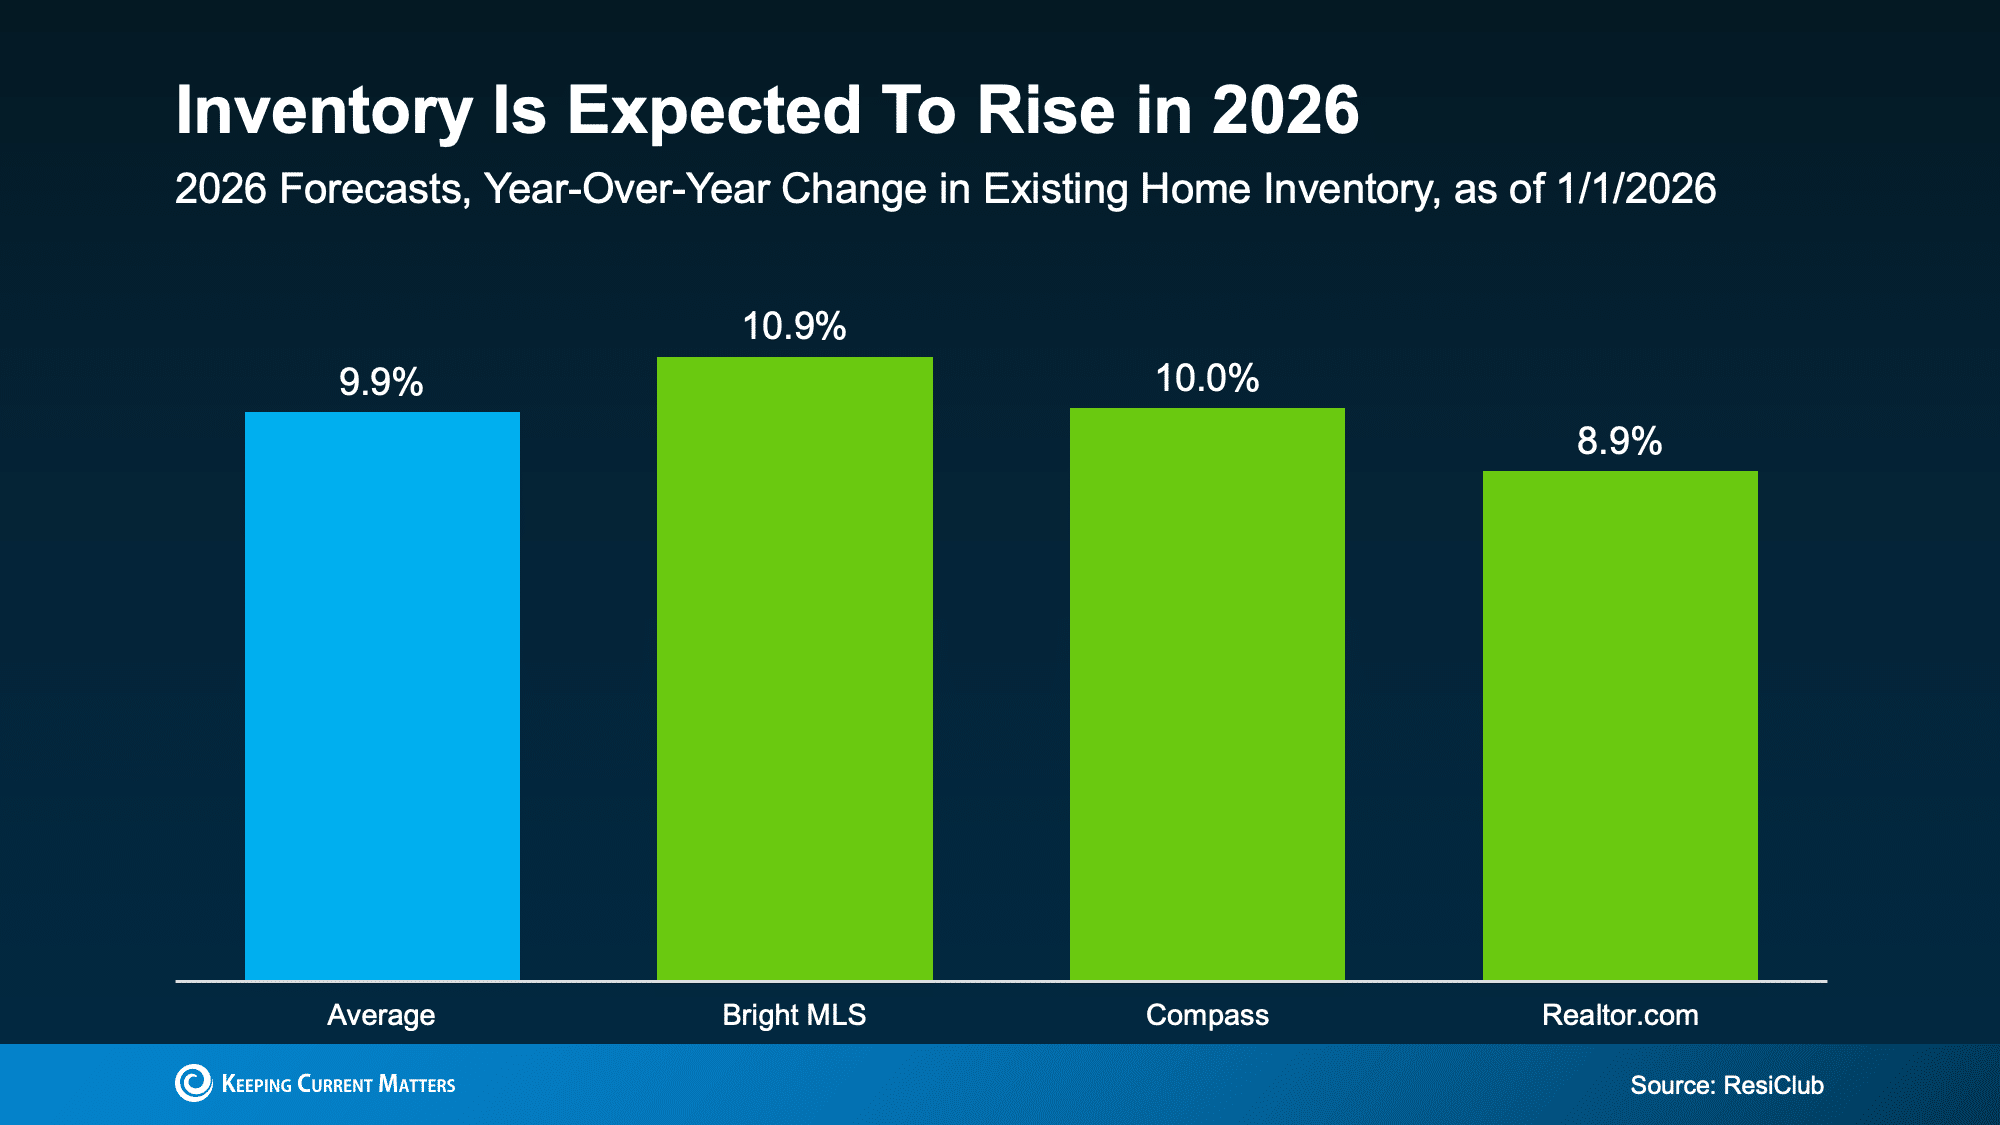
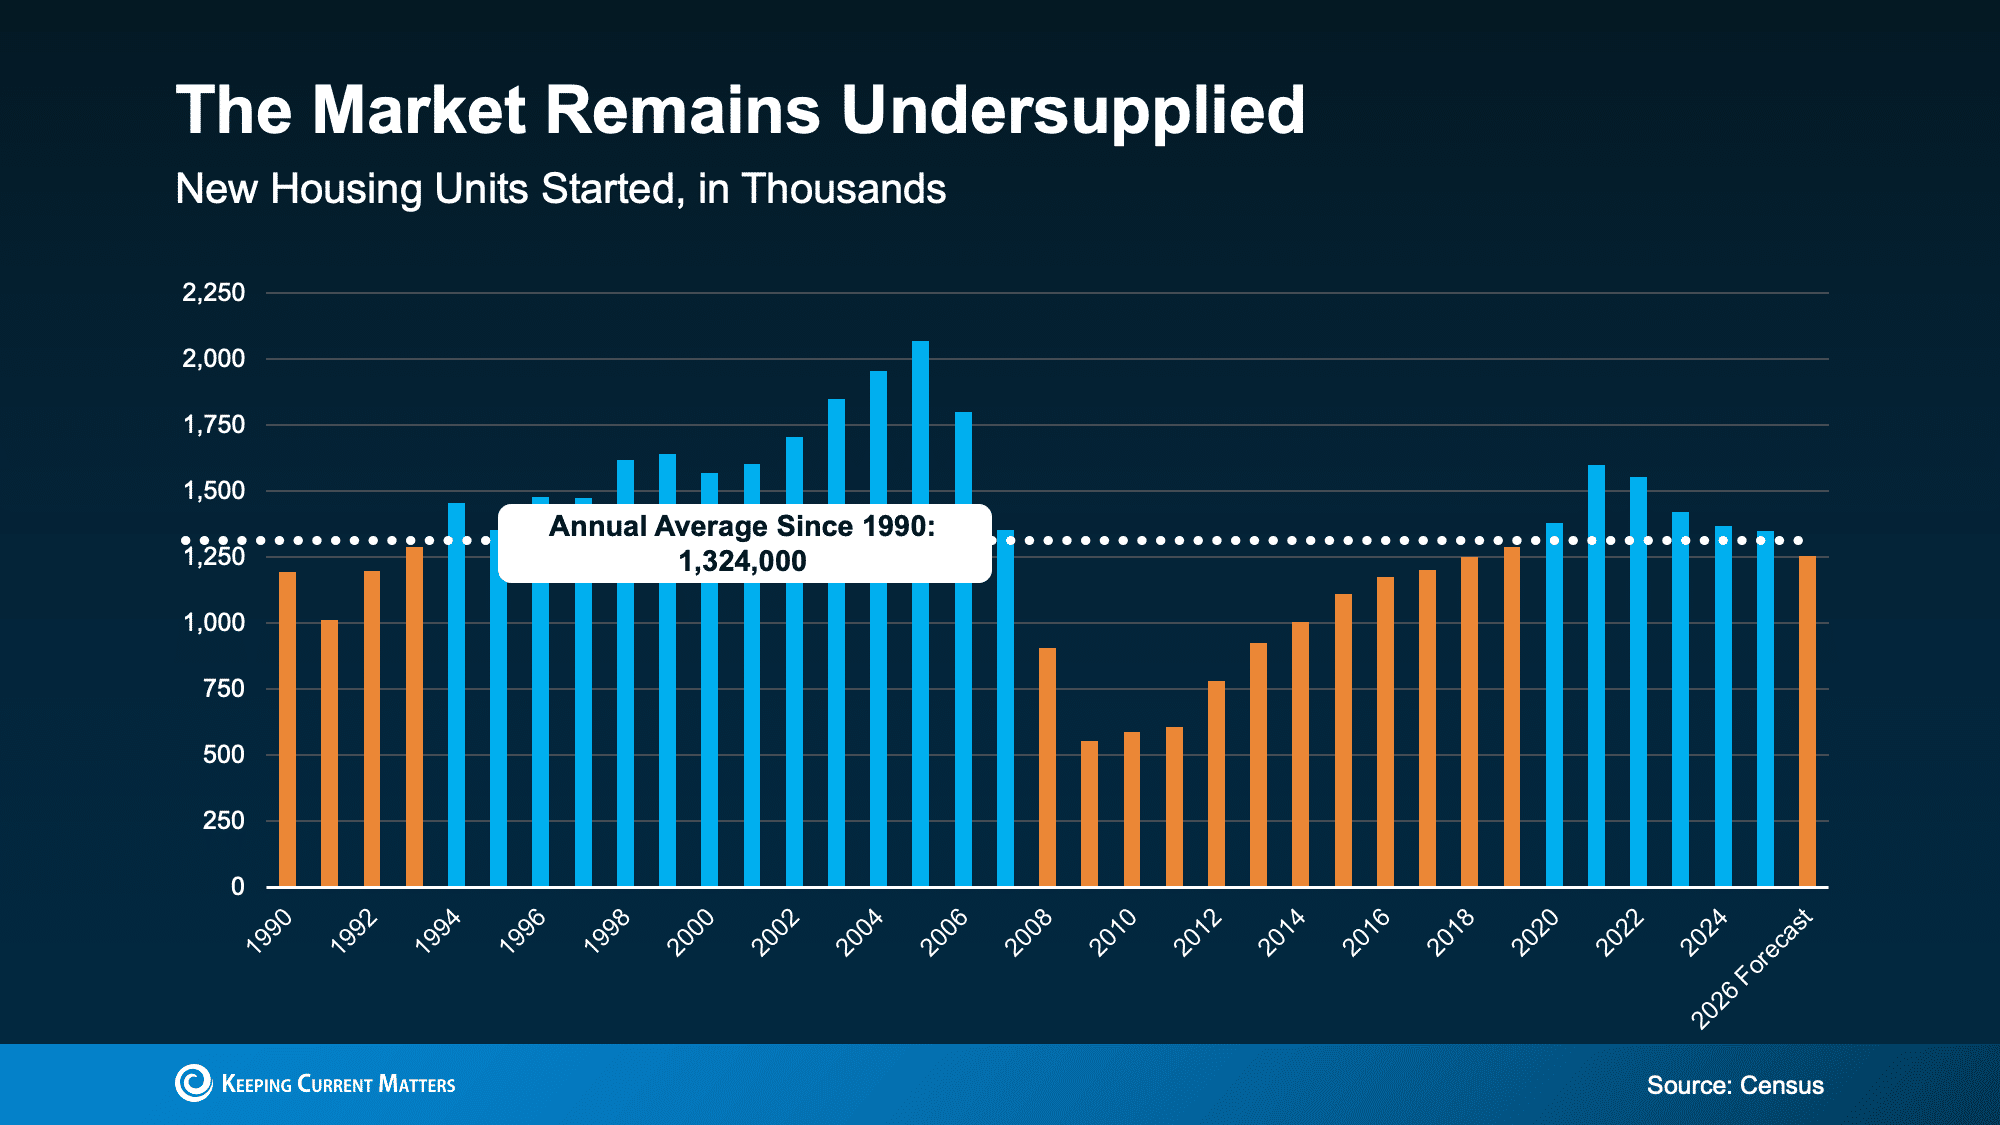
Inventory is the other half of the equation. National inventory commentary notes that at the end of December 2025, active inventory was up +12% versus December 2024, still about 5% below December 2019 levels, and that the balance of power has generally shifted toward buyers over the past year.
South Jersey Shore Market Update (Atlantic County + Cape May County): December 2025 Data
For this local section, I combine the two counties that make up what I refer to as the South Jersey Shore market: Atlantic County and Cape May County.
South Jersey Shore totals (Atlantic + Cape May combined)
-
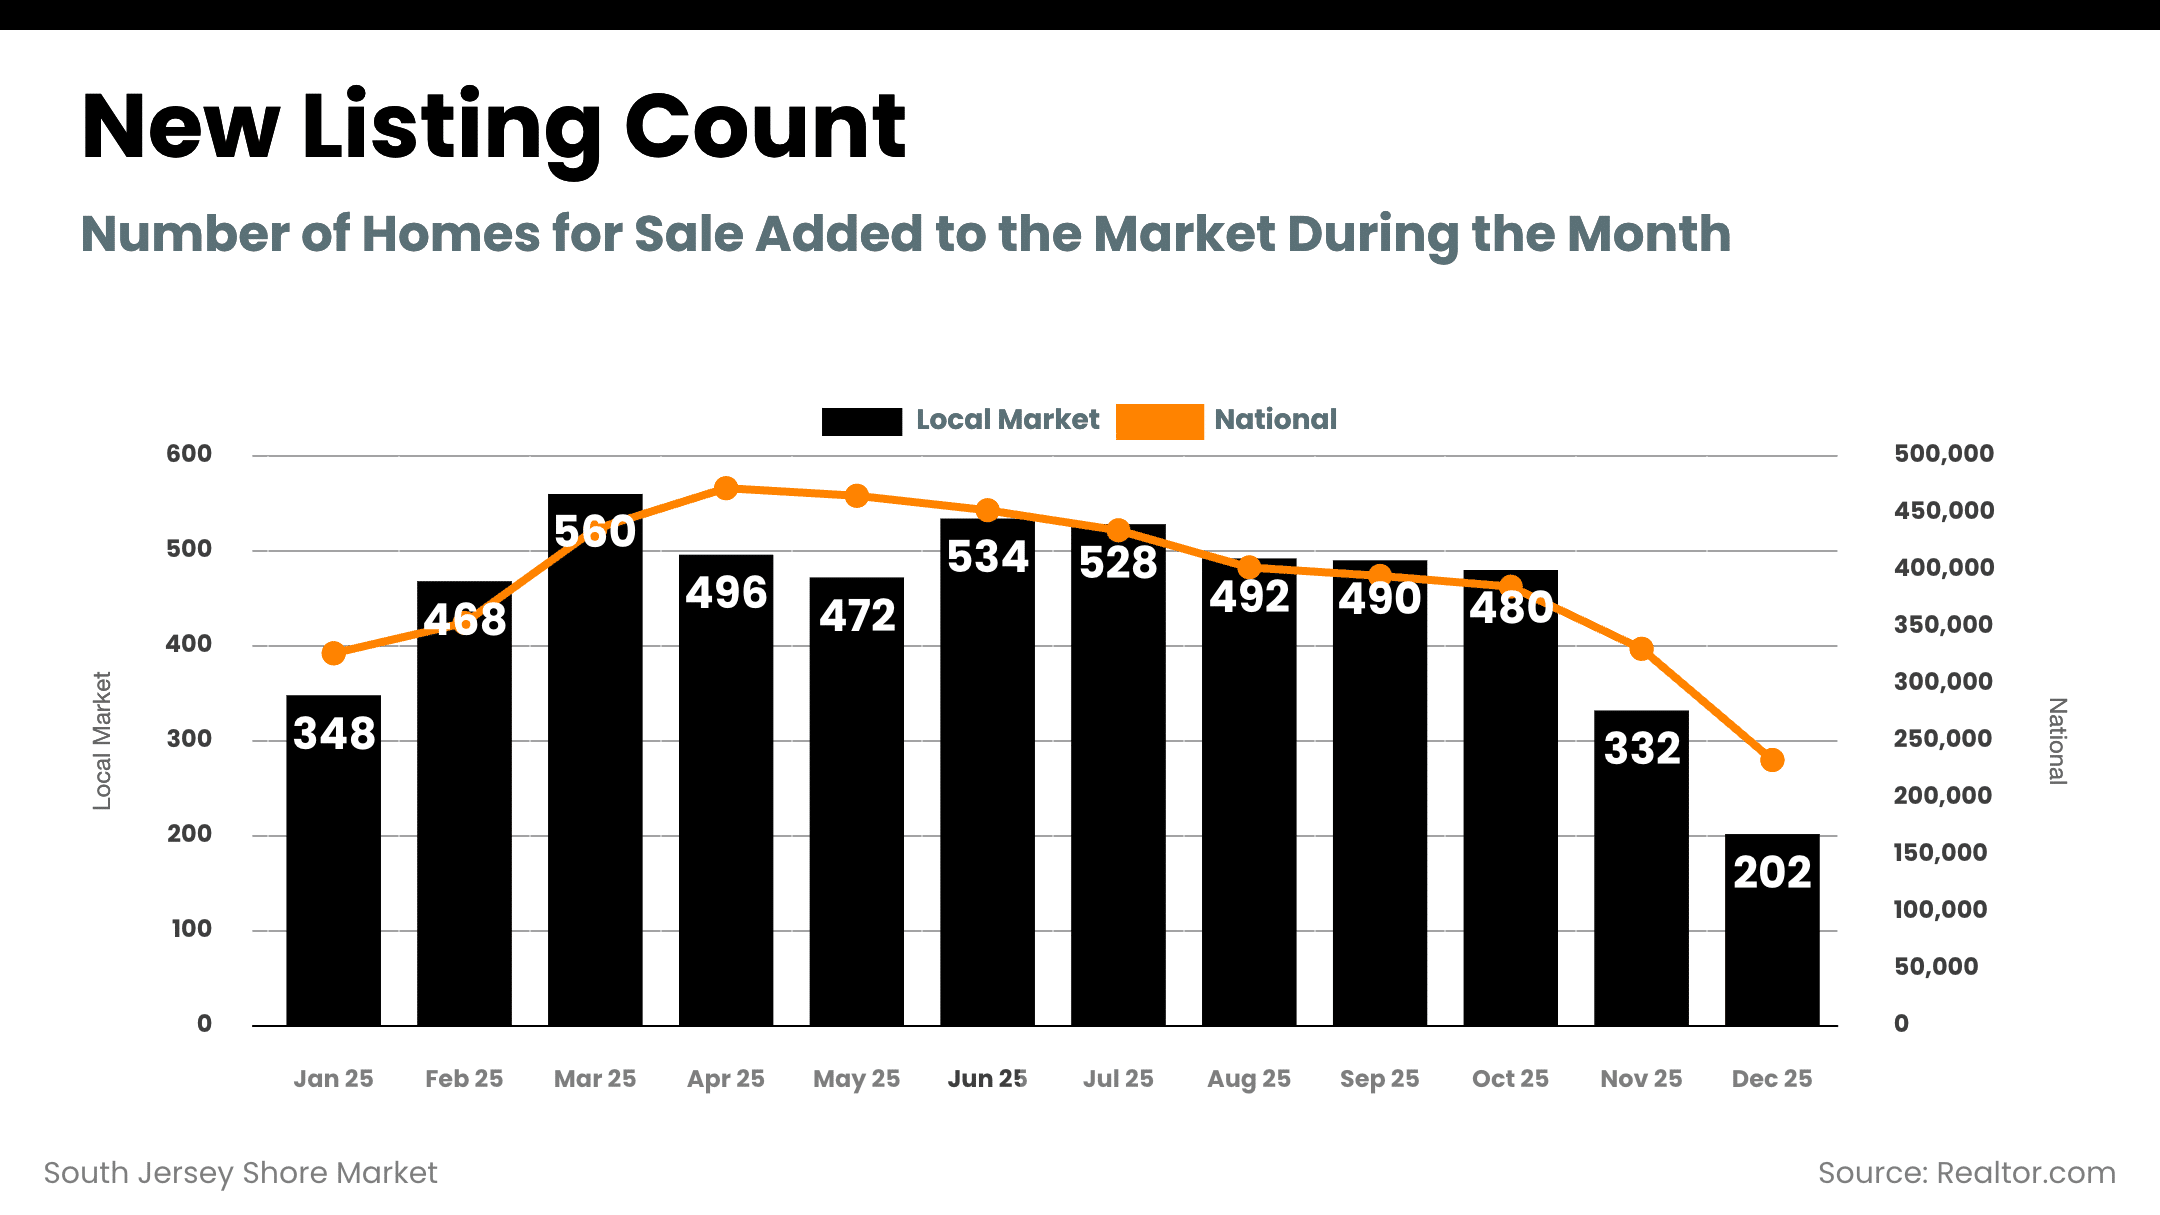
- New listings: 428 (285 Atlantic + 143 Cape May)
-
- Active listings: 2,070 (1,184 Atlantic + 886 Cape May)
-
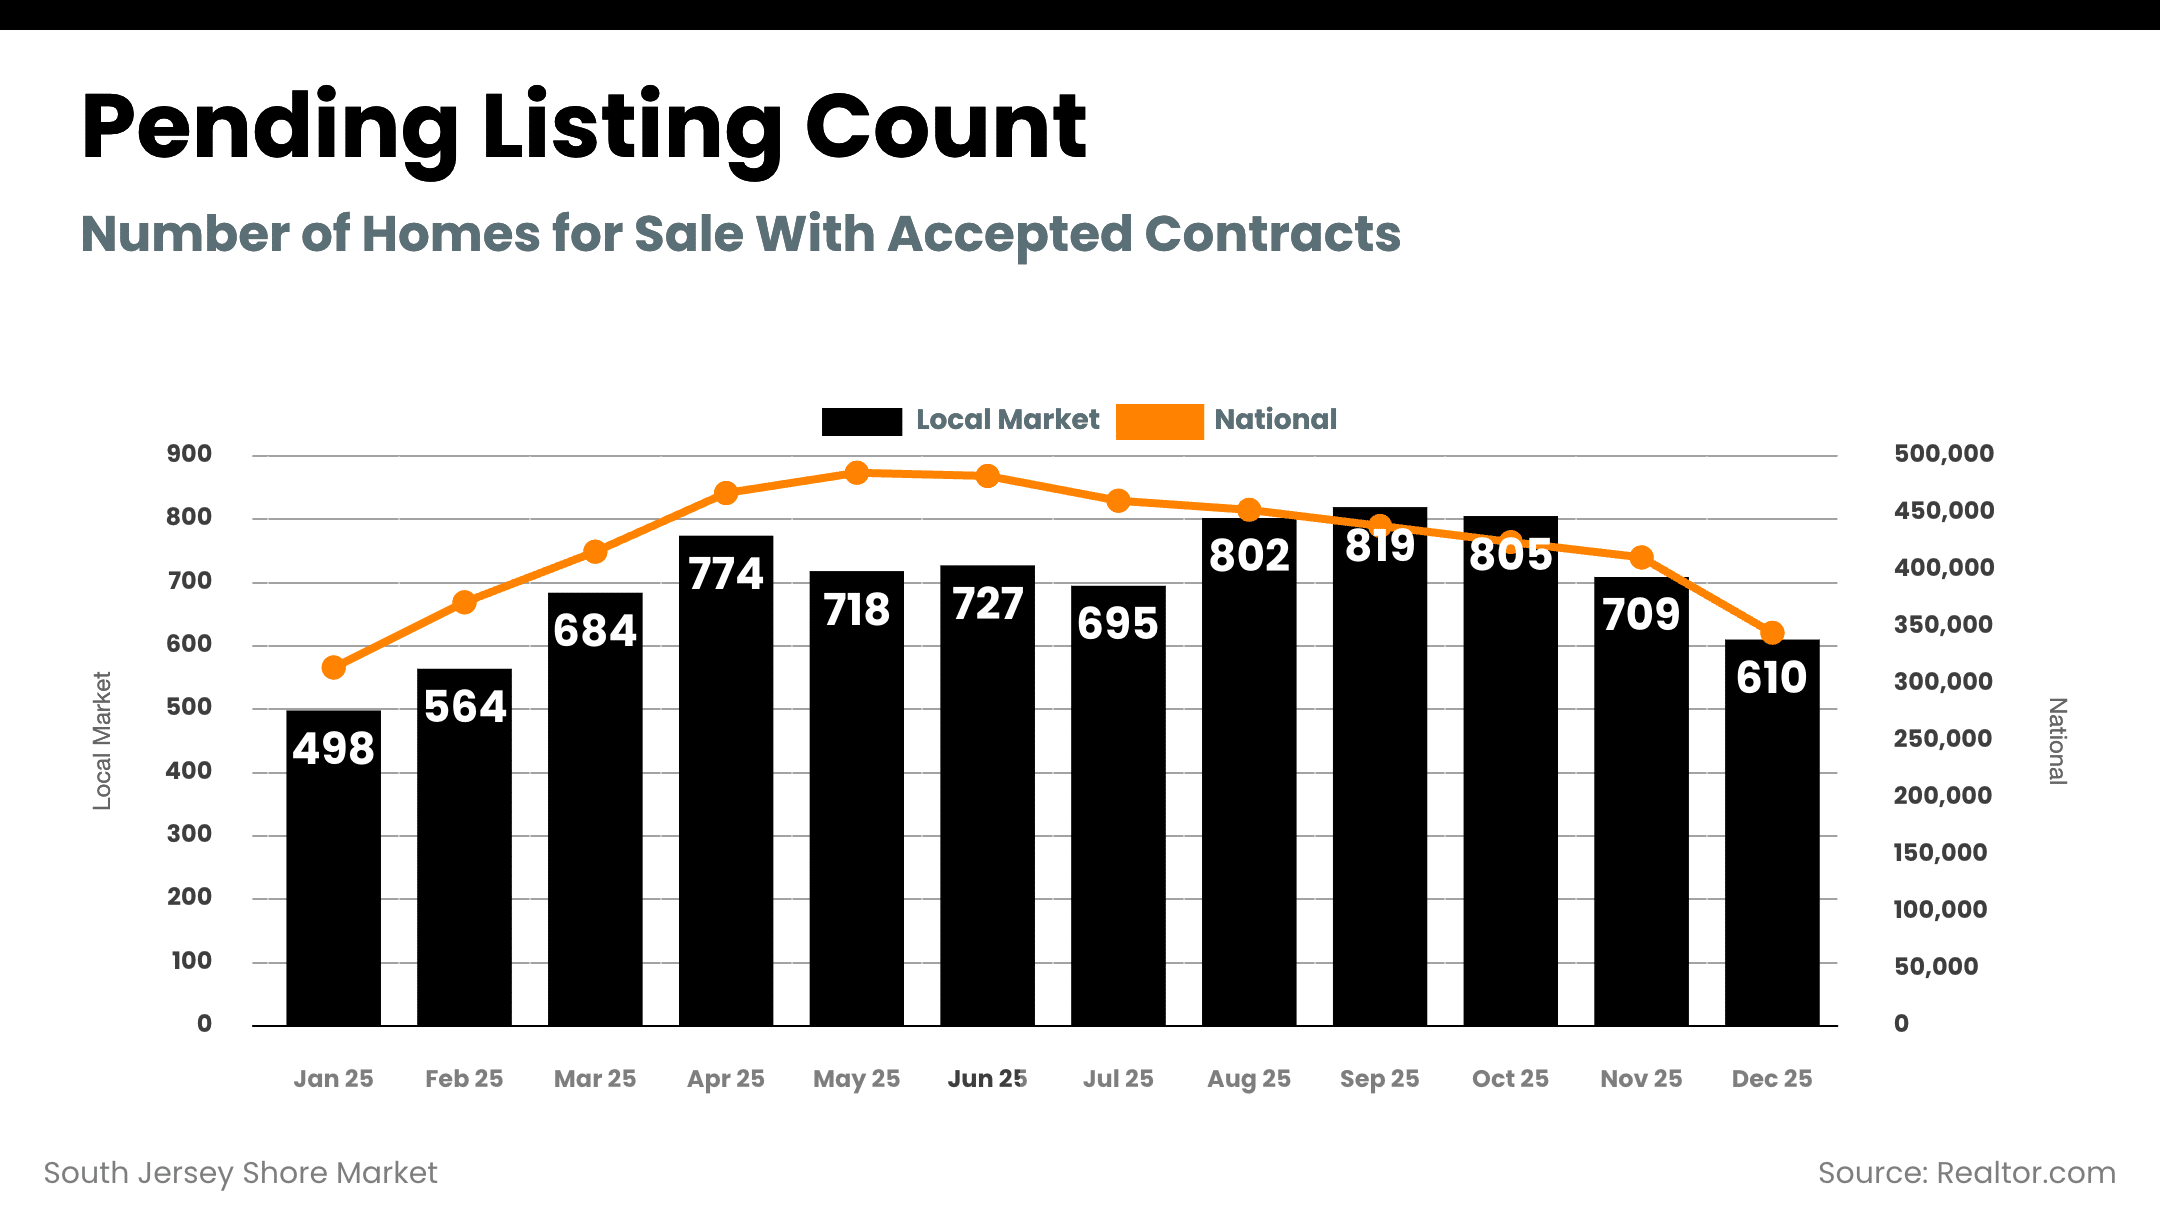
- New pending listings: 318 (189 Atlantic + 129 Cape May)
-
- Pending listings (total): 1,092 (528 Atlantic + 564 Cape May)
-
- Sold listings: 450 (261 Atlantic + 189 Cape May)
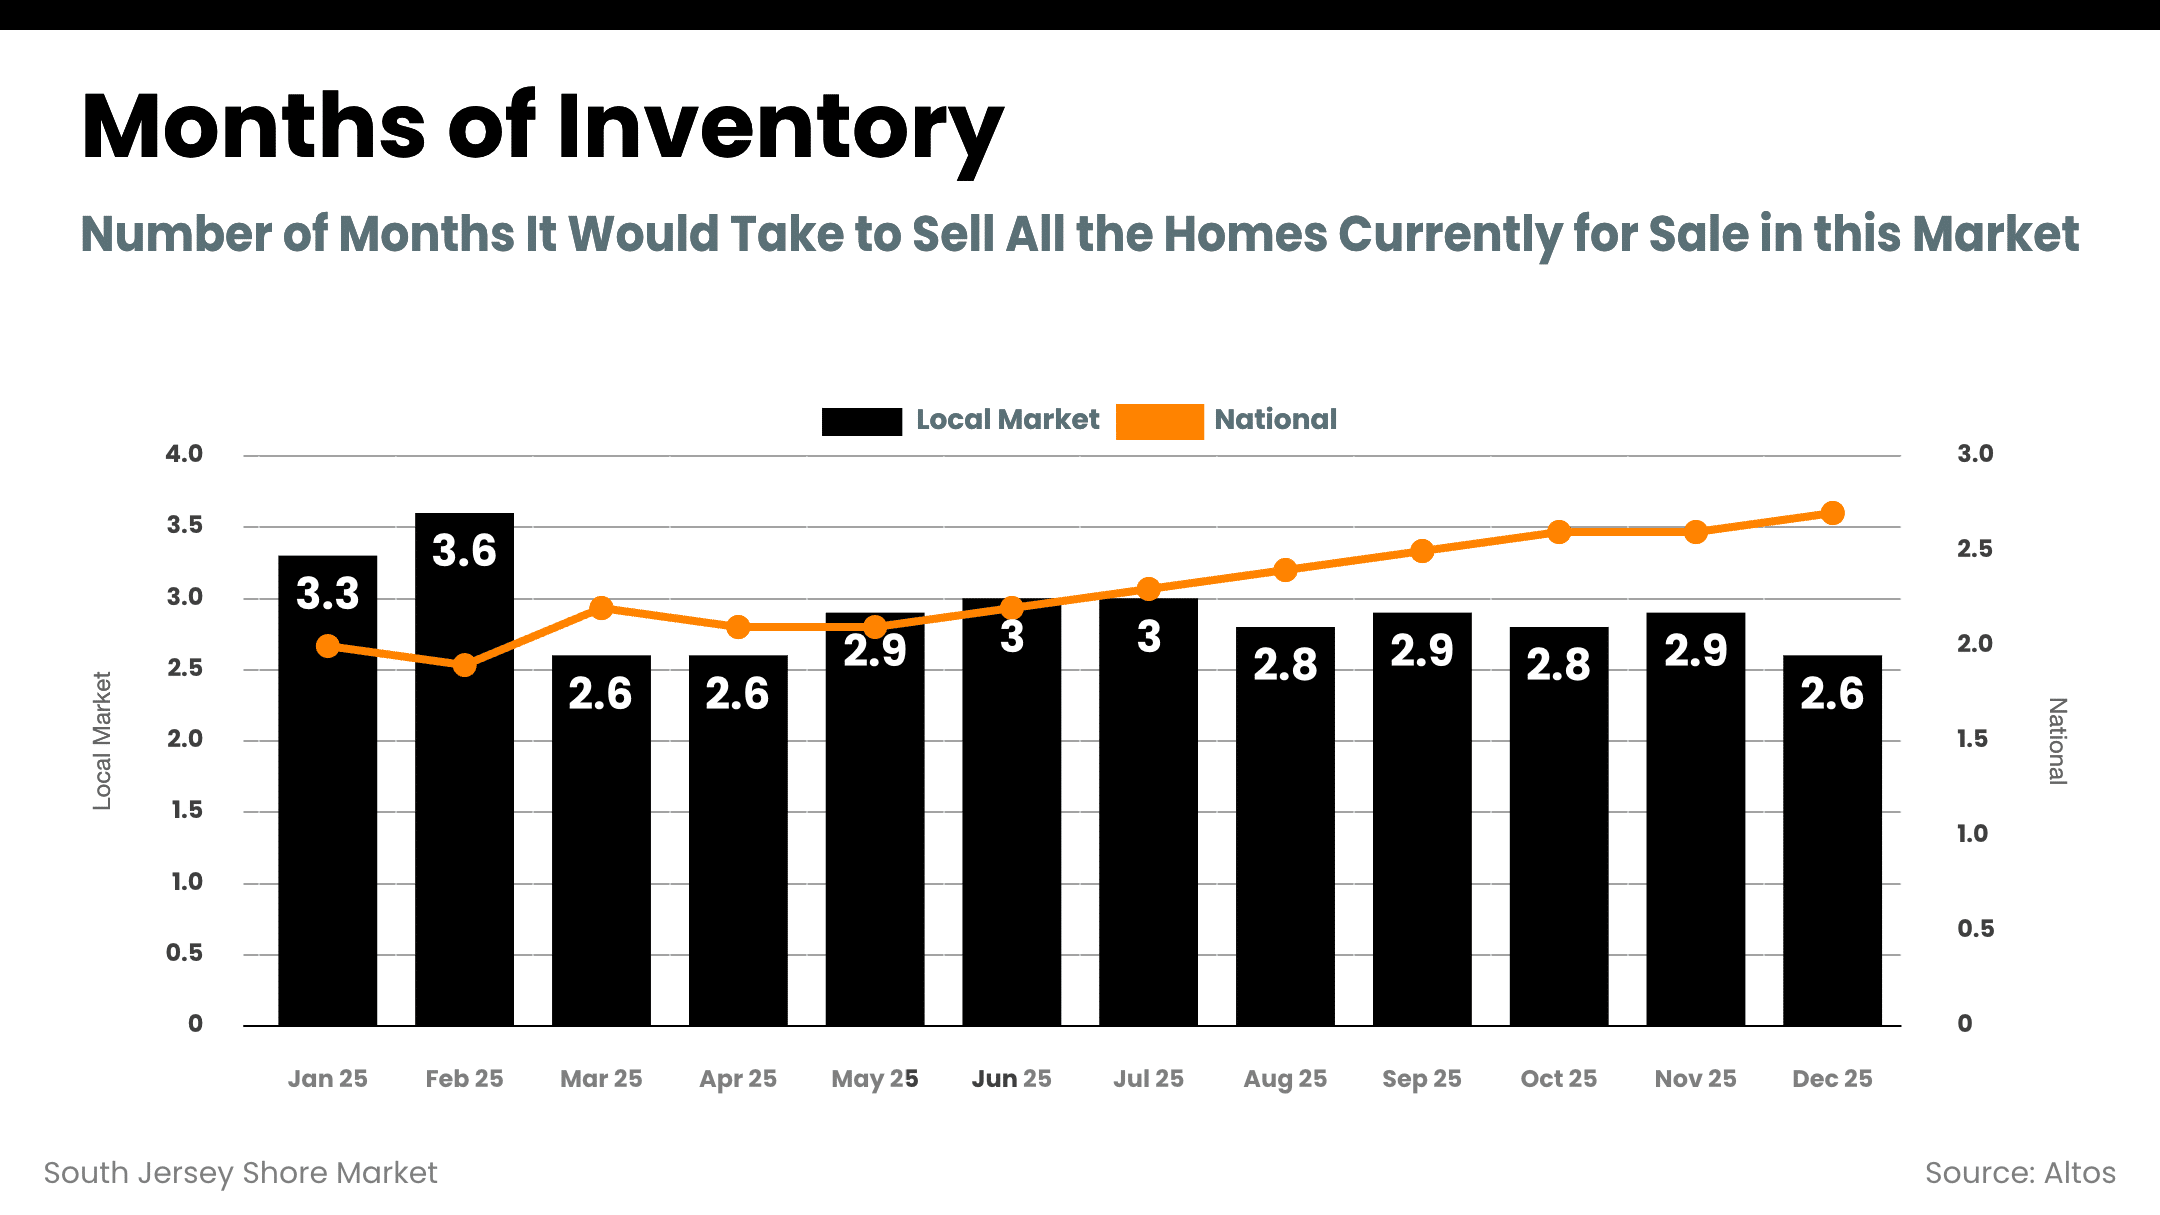
Local Supply: Still Tight (Low Months of Inventory in Both Counties)
Months of inventory remains a key “temperature gauge” for market leverage. In December 2025:
-
- Atlantic County months of inventory: 3.39
-
- Cape May County months of inventory: 3.51
Both counties are sitting in a similar band (low-to-mid 3 months). That is not “flooded with supply,” and it helps explain why well-presented, correctly priced homes can still move, even when buyers are more selective.
Local Demand: Pending Activity Stayed Meaningful, Even With Seasonal Slowdowns
Pending listings and new pending activity tell us whether buyers are actually writing contracts. In December 2025:
-
- Atlantic County new pending listings: 189
-
- Cape May County new pending listings: 129
Seasonality is real at the Shore, but contract activity remained steady enough to keep inventory from building dramatically.
Pricing: Two Different Submarkets Under One “Shore” Umbrella
One of the most important truths about the South Jersey Shore is that it contains multiple submarkets that behave differently, even in the same month. December 2025 is a perfect example:
-
- Atlantic County median sold price: $380,000
-
- Cape May County median sold price: $590,000
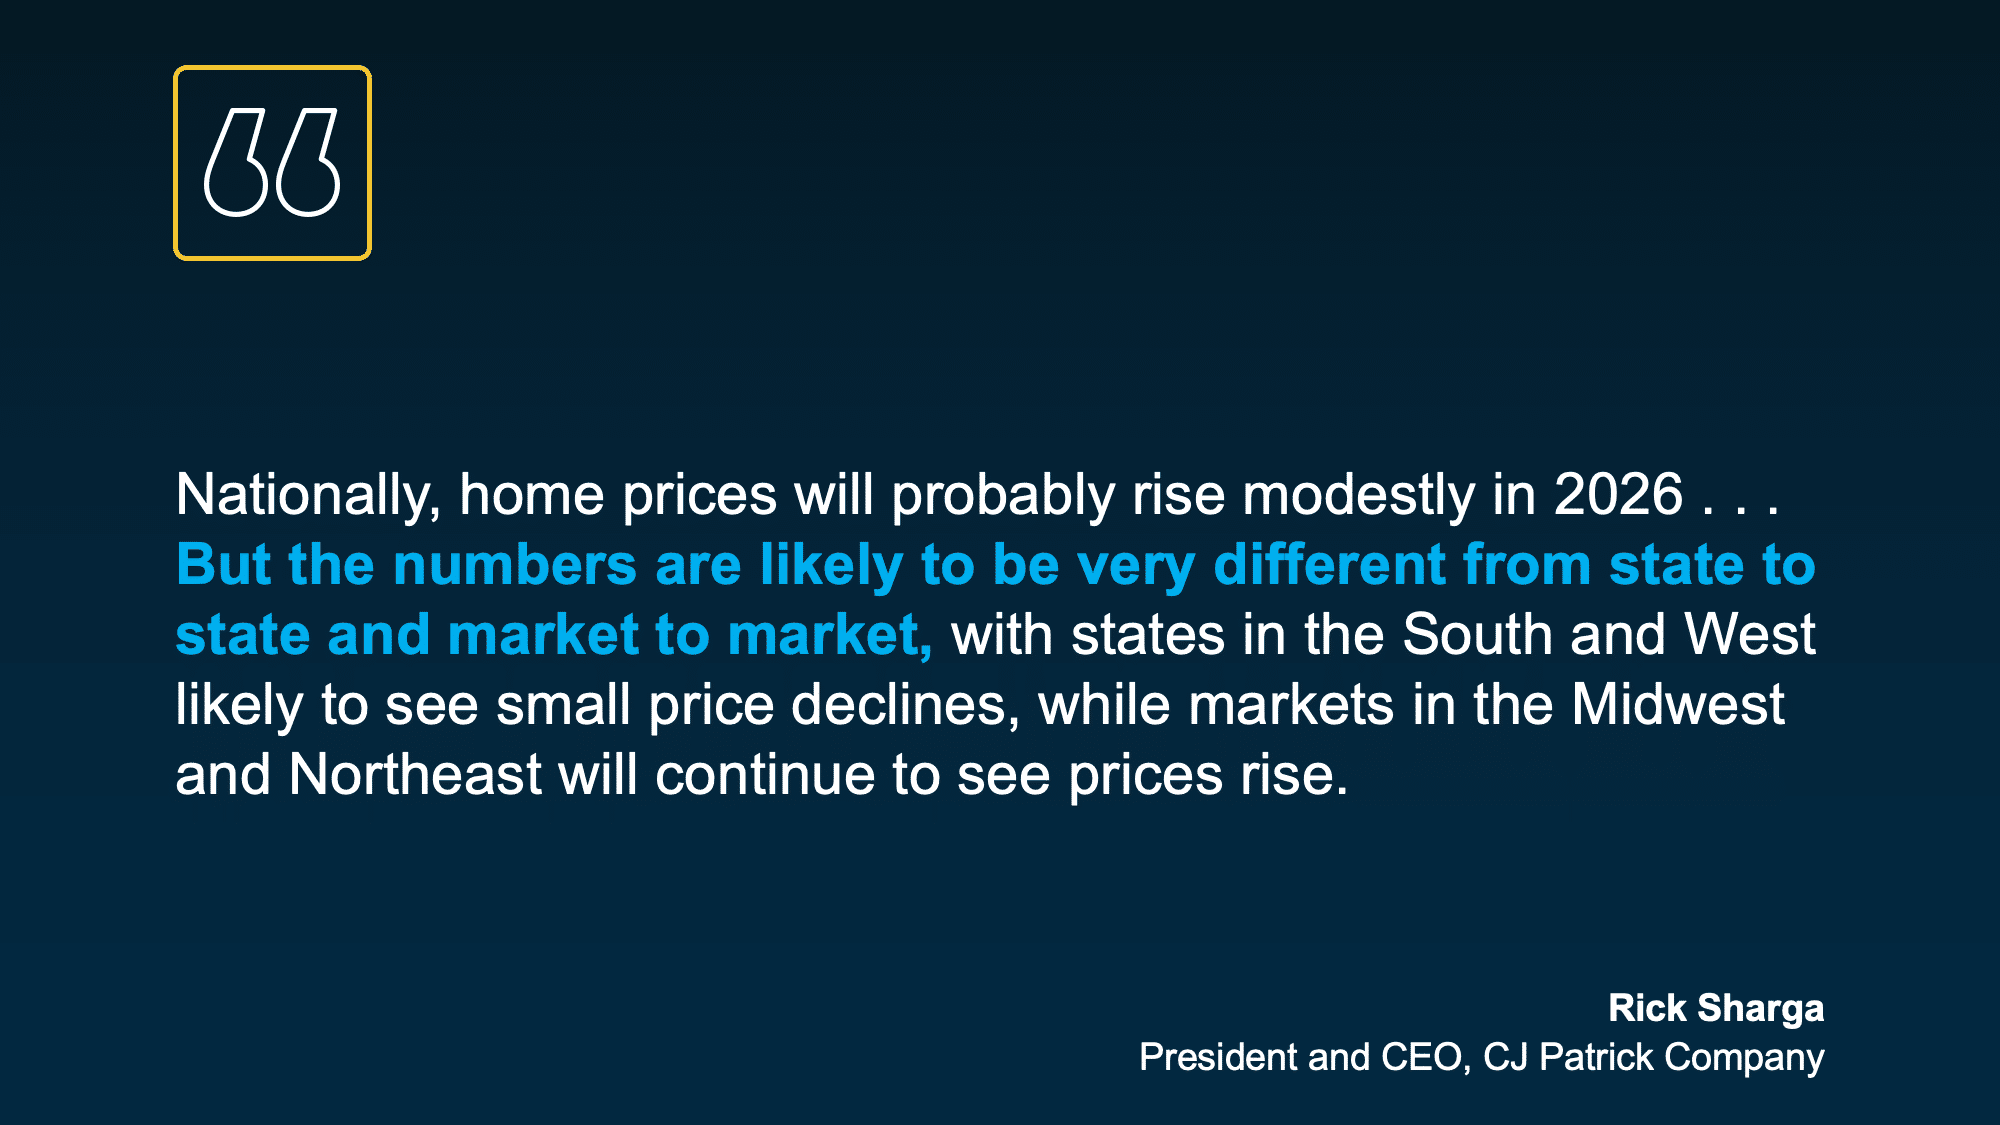
That gap is why broad “Shore market” statements can be misleading if you don’t break things down by county, town, neighborhood, and property type. Strategy should be driven by your micro-market, not national headlines.
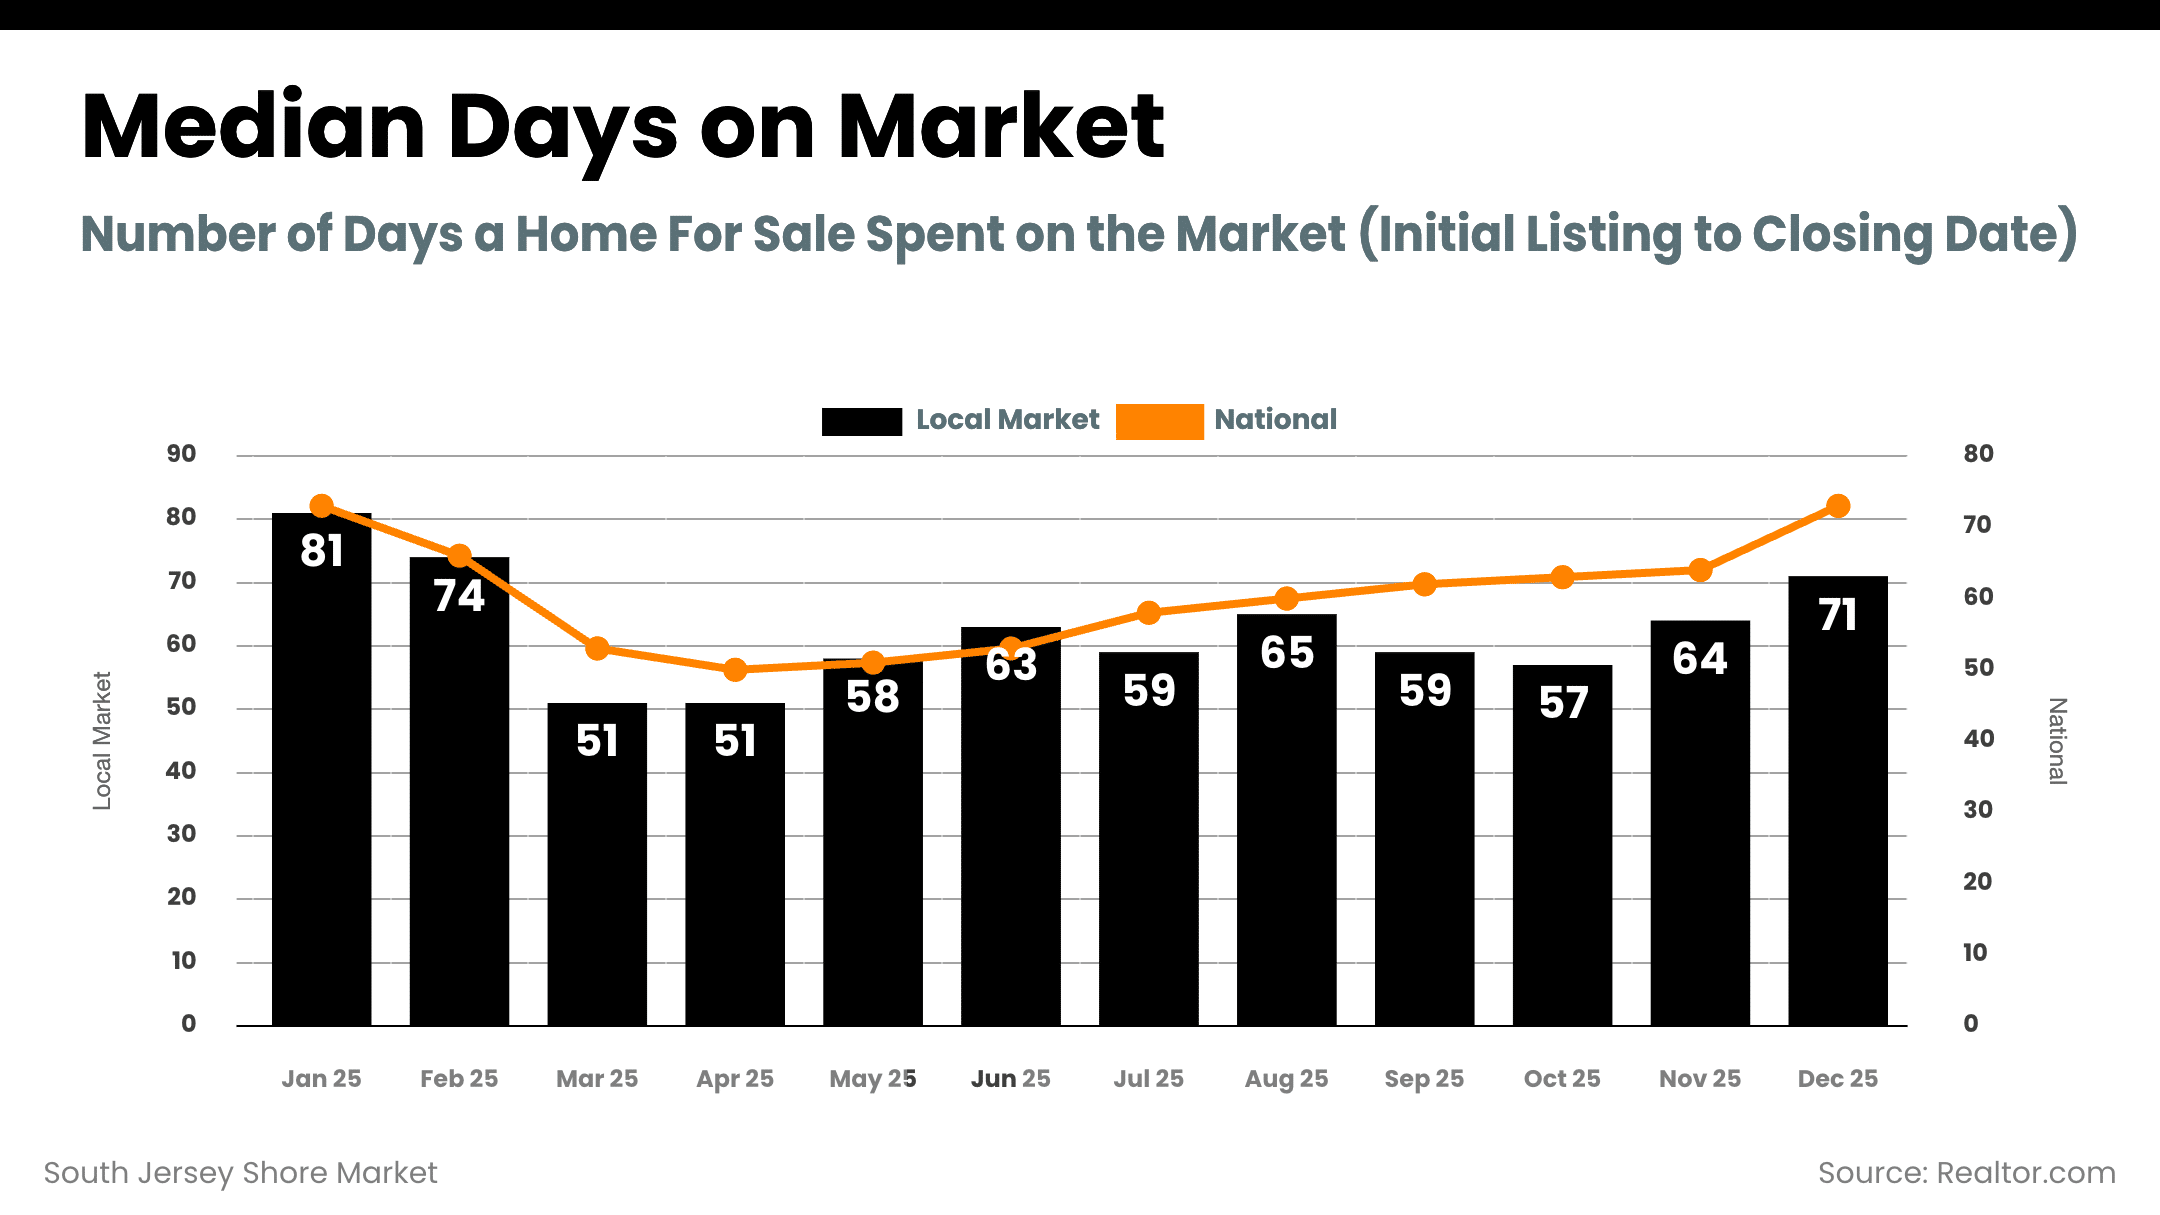
Market Pace and Negotiation: Days on Market and Sold-to-List Ratios
Two practical indicators for sellers and buyers are (1) how long homes are taking to sell and (2) how close to list price they’re closing.
-
- Atlantic County median days on market: 34; sold-to-list: 97.56%
-
- Cape May County median days on market: 40; sold-to-list: 97.38%
In plain English: most homes are not selling for “full ask,” but they are still selling fairly close to list price. That’s consistent with a market that’s tighter than it feels at first glance, especially when a property is priced correctly and marketed well.
What This Means If You’re Selling in Atlantic County or Cape May County in Early 2026
-
- Pricing precision matters more than ever. Nationally, price cuts remained elevated in December (12.9% of listings had a price cut).
-
- Condition and presentation create leverage. In a market where buyers have more choices than a year ago, “average” listings sit longer and invite negotiation.
-
- List-to-sale expectations should be realistic. With sold-to-list ratios around 97% to 98% locally, most sellers should plan for normal negotiation.
What This Means If You’re Buying at the South Jersey Shore in Early 2026
-
- Watch rates, but don’t wait for perfection. January rate headlines show how quickly conditions can change, and how volatile the bond market can be.
-
- Use inventory and days on market to guide your offer strategy. If a home is fresh and correctly priced, it can still move quickly. If it’s been sitting, the data supports negotiating more assertively.
-
- Know your submarket. Atlantic County and Cape May County are operating at very different price points, and strategy should reflect that.
Bottom Line: January 2026 Starts With a “Steadier” Market, Not a Frenzy
National data points to gradually improving supply and a market moving toward balance. Locally, the South Jersey Shore remains relatively tight on inventory (both counties around the mid-3 months of supply), with meaningful contract activity and pricing that reflects very different submarkets under the same coastal umbrella.
Local Area Specific Market Reports (these reports are updated every 48 hours)
South Jersey Shore Real Estate Market FAQ (January 2026)
Is the South Jersey Shore still a seller’s market?
Inventory remains relatively tight in both Atlantic County and Cape May County, with roughly 3.4 to 3.5 months of supply, which continues to support sellers who price and present their homes correctly.
How many homes are currently for sale in the South Jersey Shore market?
As of the latest data in this report, there are 2,070 active listings across the South Jersey Shore market, including 1,184 in Atlantic County and 886 in Cape May County.
Are buyers still active in the South Jersey Shore real estate market?
Yes. Buyer activity remains steady, with 318 new pending listings recorded in December 2025 across Atlantic County and Cape May County combined.
How long does it take to sell a home at the South Jersey Shore?
Homes are taking longer to sell compared to prior years. Median days on market are 34 days in Atlantic County and 40 days in Cape May County.
Are homes selling at full asking price?
Most homes are selling slightly below list price. The sold-to-list ratio is approximately 97.6% in Atlantic County and 97.4% in Cape May County.
Is 2026 a good year to sell a home in Atlantic County or Cape May County?
Sellers who price accurately and prepare their homes well are positioned to succeed in 2026, especially in markets with limited inventory and steady buyer demand.