


Local coverage: South Jersey Shore Market (Atlantic County + Cape May County, NJ)
Release timing note: This February 2026 update reflects the latest published January 2026 housing data and early-2026 trends.
National Housing Market Snapshot (January 2026)
Nationally, the inventory recovery is still moving forward year over year, but it has lost momentum. Active listings were up 10% from January 2025, marking the 27th consecutive month of annual gains, yet growth has slowed for nine straight months. Even with those gains, active inventory remained 17.2% below typical pre-pandemic 2017–2019 levels.
New listings and buyer activity improved to start the year. Newly listed homes were up 0.7% year over year, and pending sales were up 1.2% year over year (the strongest annual gain since late 2024). Homes took longer to sell: the typical home spent 78 days on market nationally, 5 days longer than a year ago. Prices were essentially flat: the national median list price was $399,900, basically unchanged year over year.
Mortgage Rates and Affordability: The 2026 Storyline
A key national driver entering 2026 is improving affordability, helped by the combination of easing mortgage rates, moderating price growth, and steady income gains. National commentary going into 2026 points to mortgage rates around the low-6% range, and forecasts commonly discuss rates averaging about 6% in 2026.
NAR highlighted that December’s average 30-year fixed mortgage rate was around 6.19%, down from roughly 7% at the start of 2025, and that this decline has translated into meaningful monthly payment savings that can pull more qualified buyers back into the market. At the same time, NAR emphasized inventory constraints still matter, especially in supply-tight regions.
Practical takeaway: in a rate-sensitive market, even modest rate declines can increase buyer activity. This is especially relevant as we move from winter into the spring market cycle, when more inventory typically arrives and more buyers re-enter.
South Jersey Shore Market (Atlantic + Cape May): What the Data Says Right Now
Two important notes about the data sources
- Realtor.com county metrics focus on listings visible through Realtor.com and provide a consistent way to track inventory, new listings, pending listings, and days on market over time.
- MLS-based RPR county reports summarize market activity from listing systems (SF + Condo/TH/Apt) and include months of inventory, sold-to-list price ratio, sold pricing, and additional listing/pending detail.
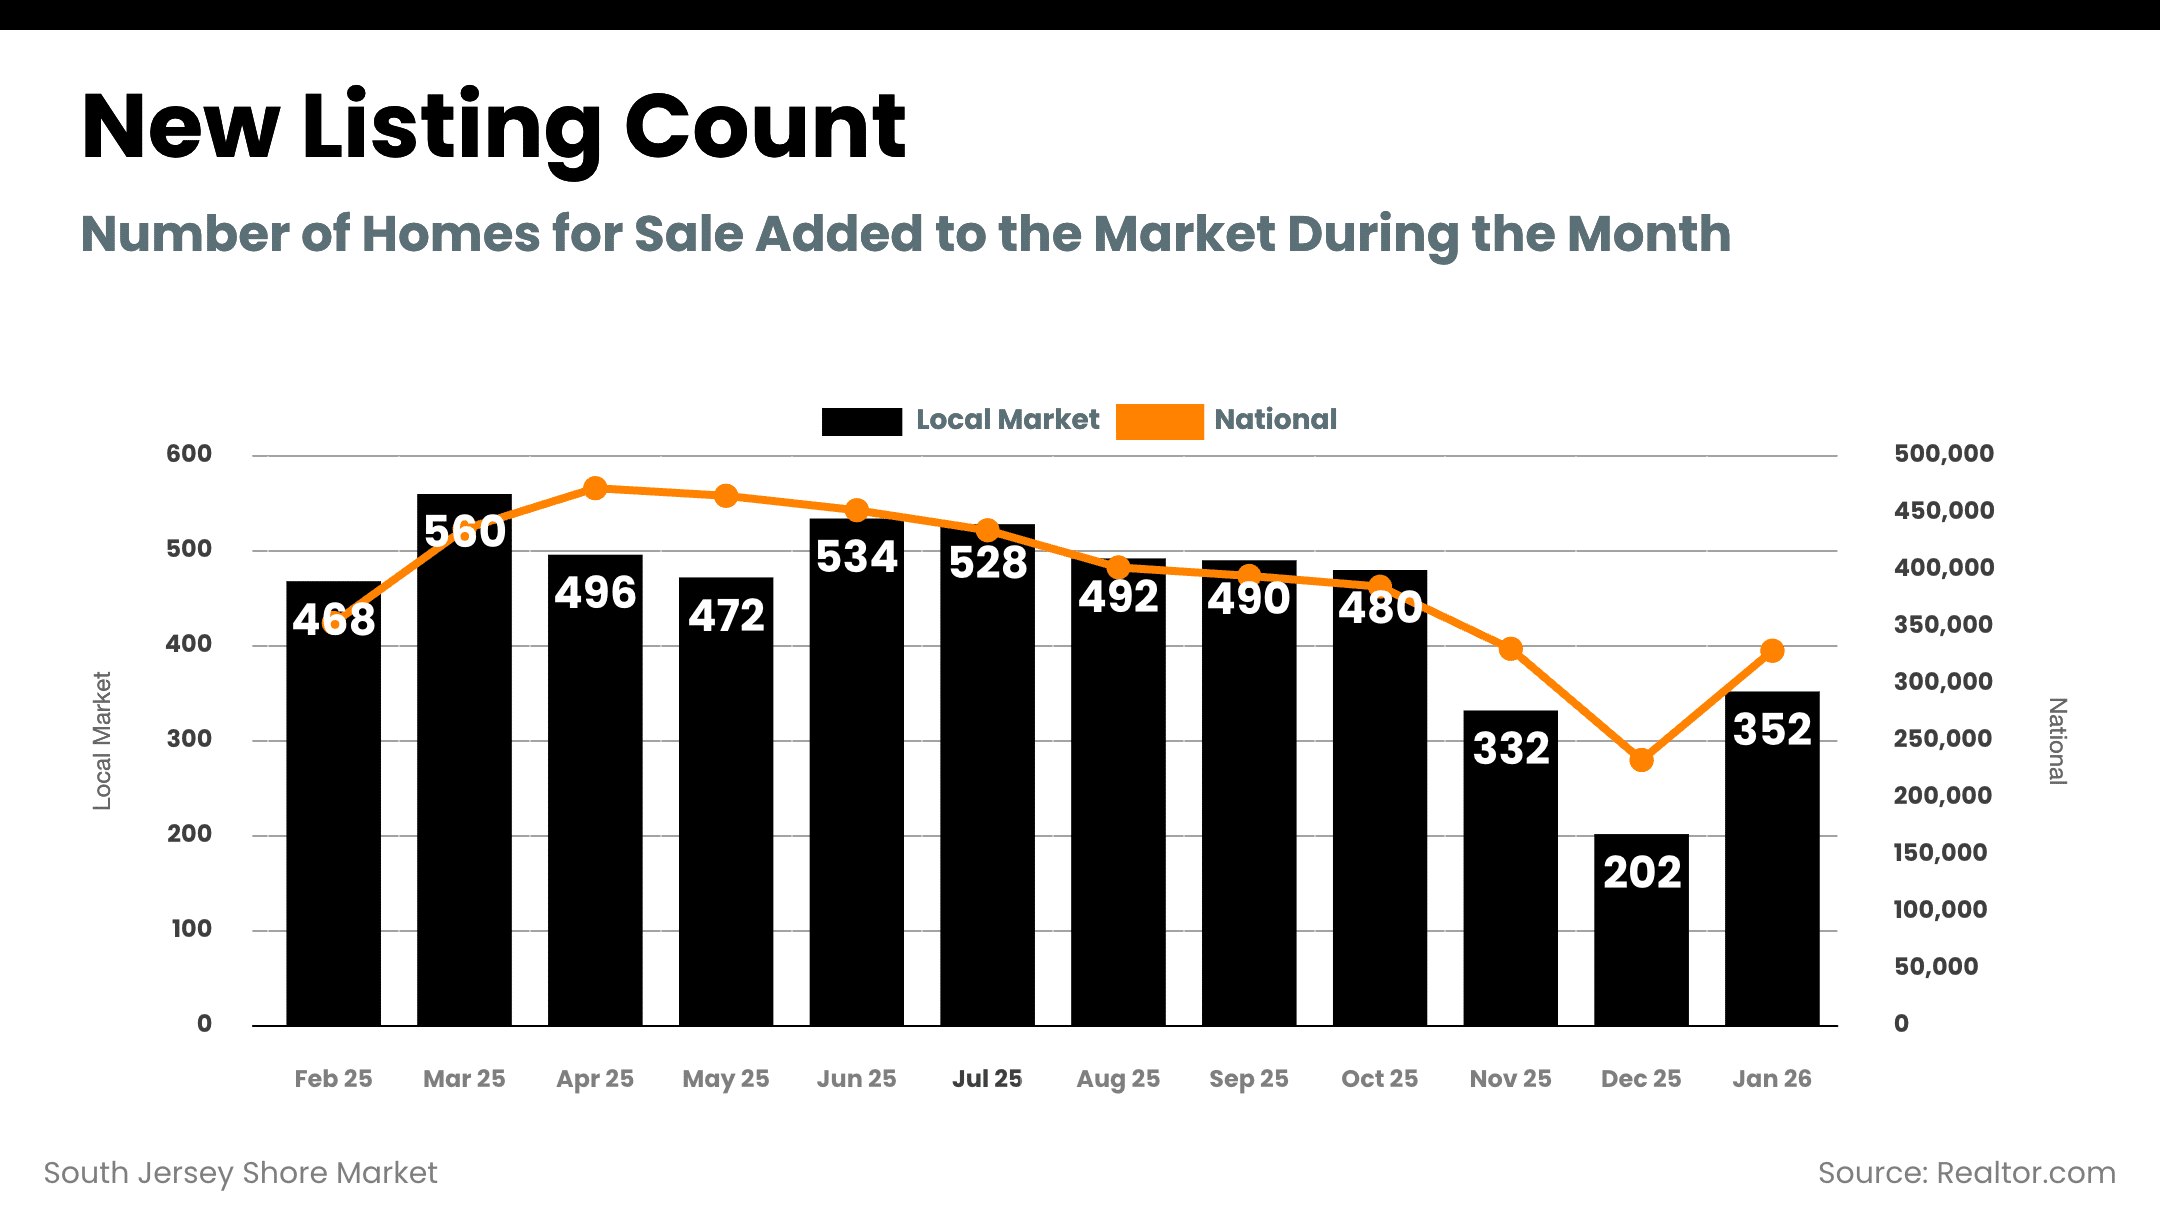
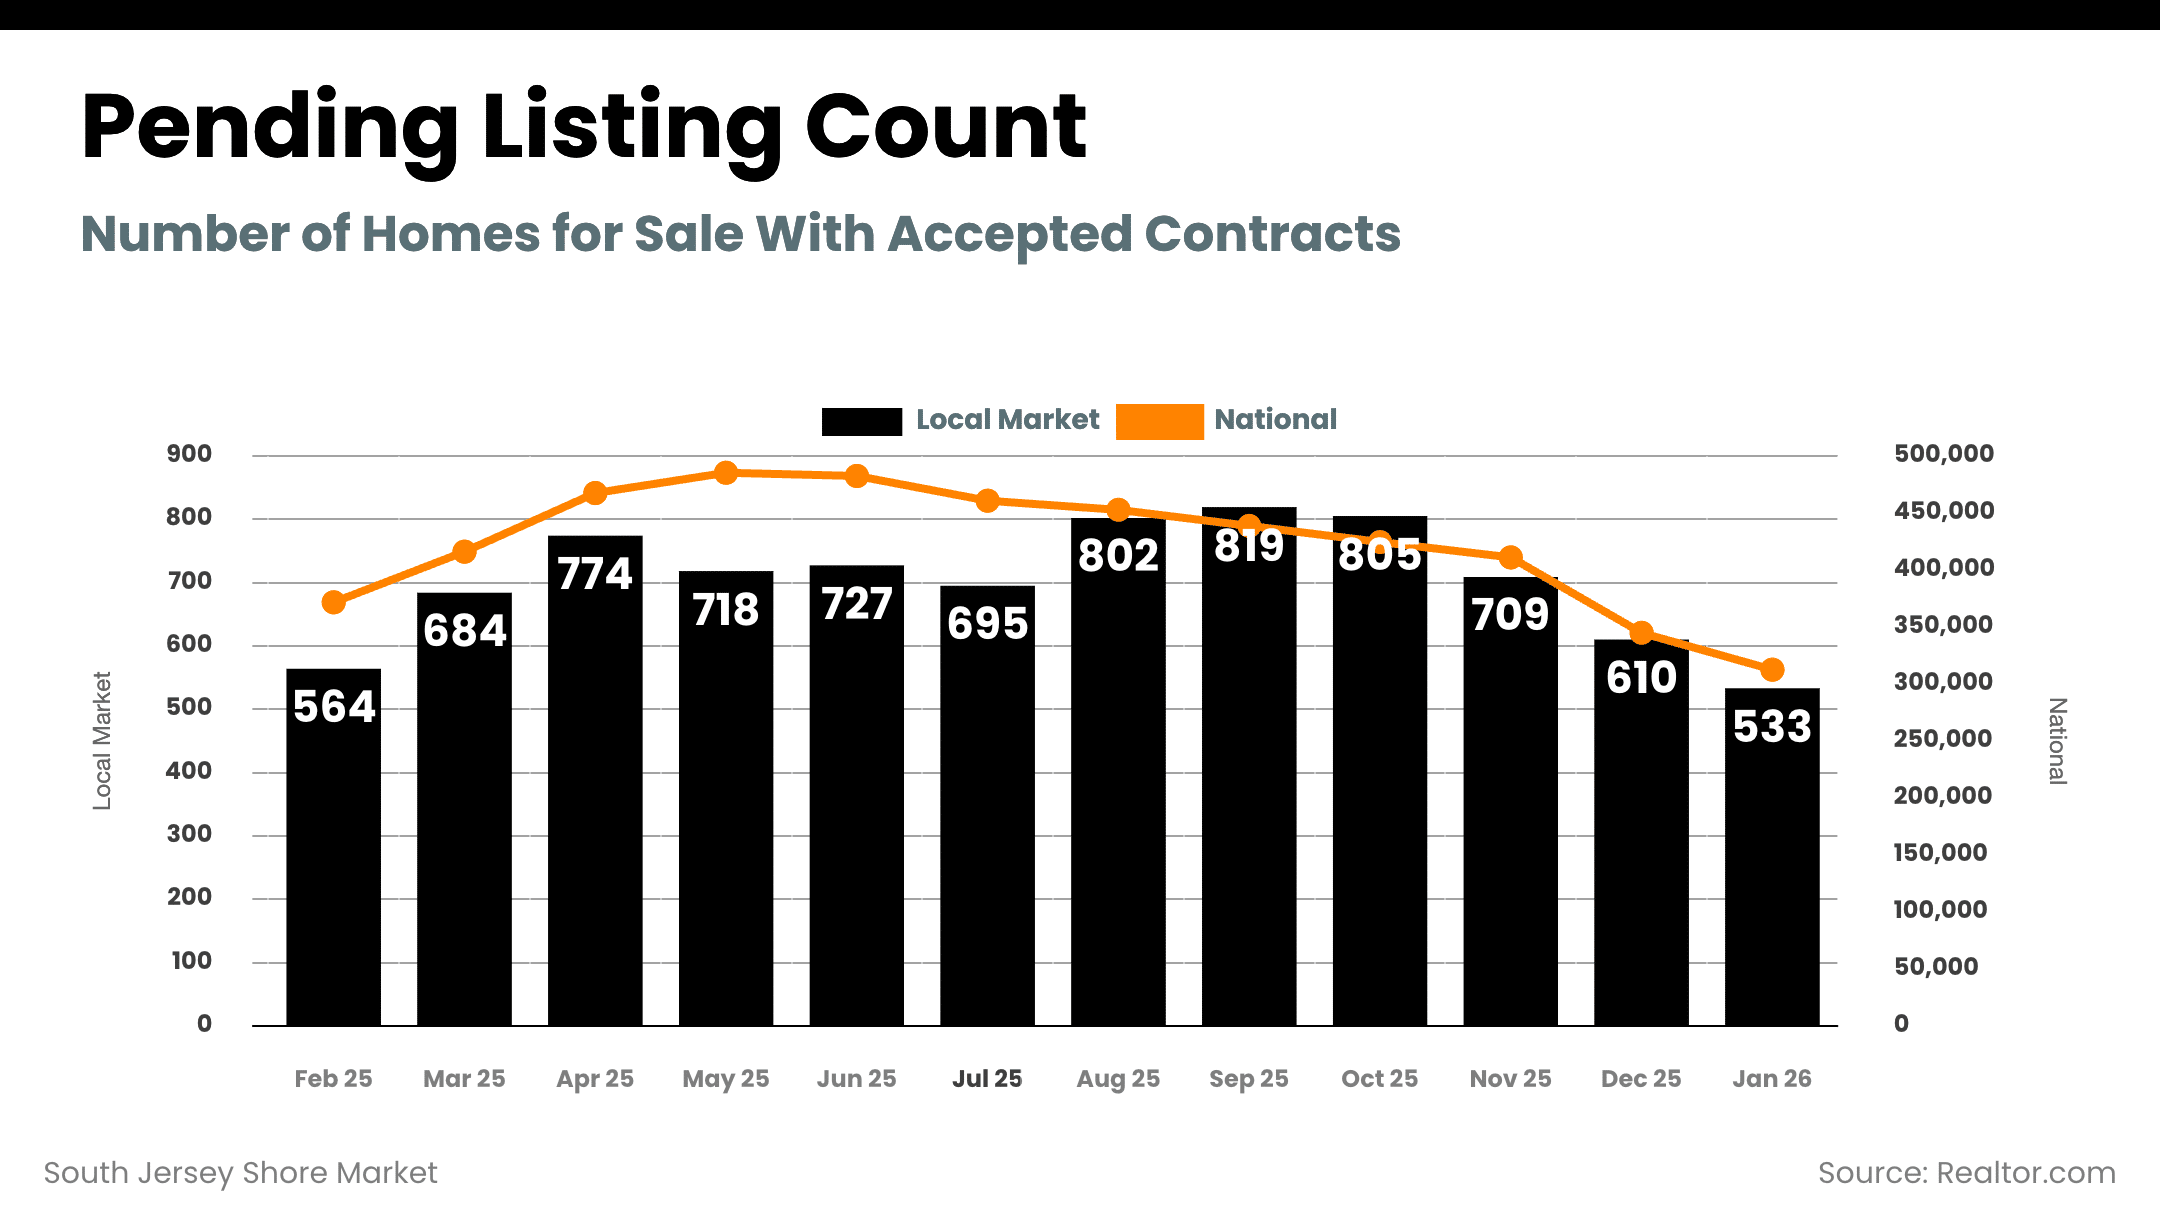
South Jersey Shore inventory and activity (Realtor.com county history)
Combining Atlantic County and Cape May County (Realtor.com county history), the South Jersey Shore showed:
- Active listings: 1,737 in January 2026 (about +5.5% YoY; about -5.6% MoM)
- New listings: 568 in January 2026 (about -1.7% YoY; about +67.1% MoM seasonal jump)
- Pending listings: 721 in January 2026 (about -3.4% YoY; about -13.7% MoM)
Reading this together: our local market is still defined by limited supply overall, but early-year seller activity (new listings) picked up seasonally. Pending activity cooled month over month, which is common around the year-end and early-winter transition, but it will be important to watch whether improving affordability converts into stronger contract volume as we move deeper into Q1 and Q2.
Atlantic County and Cape May County side-by-side (MLS/RPR snapshots)
Atlantic County (January 2026)
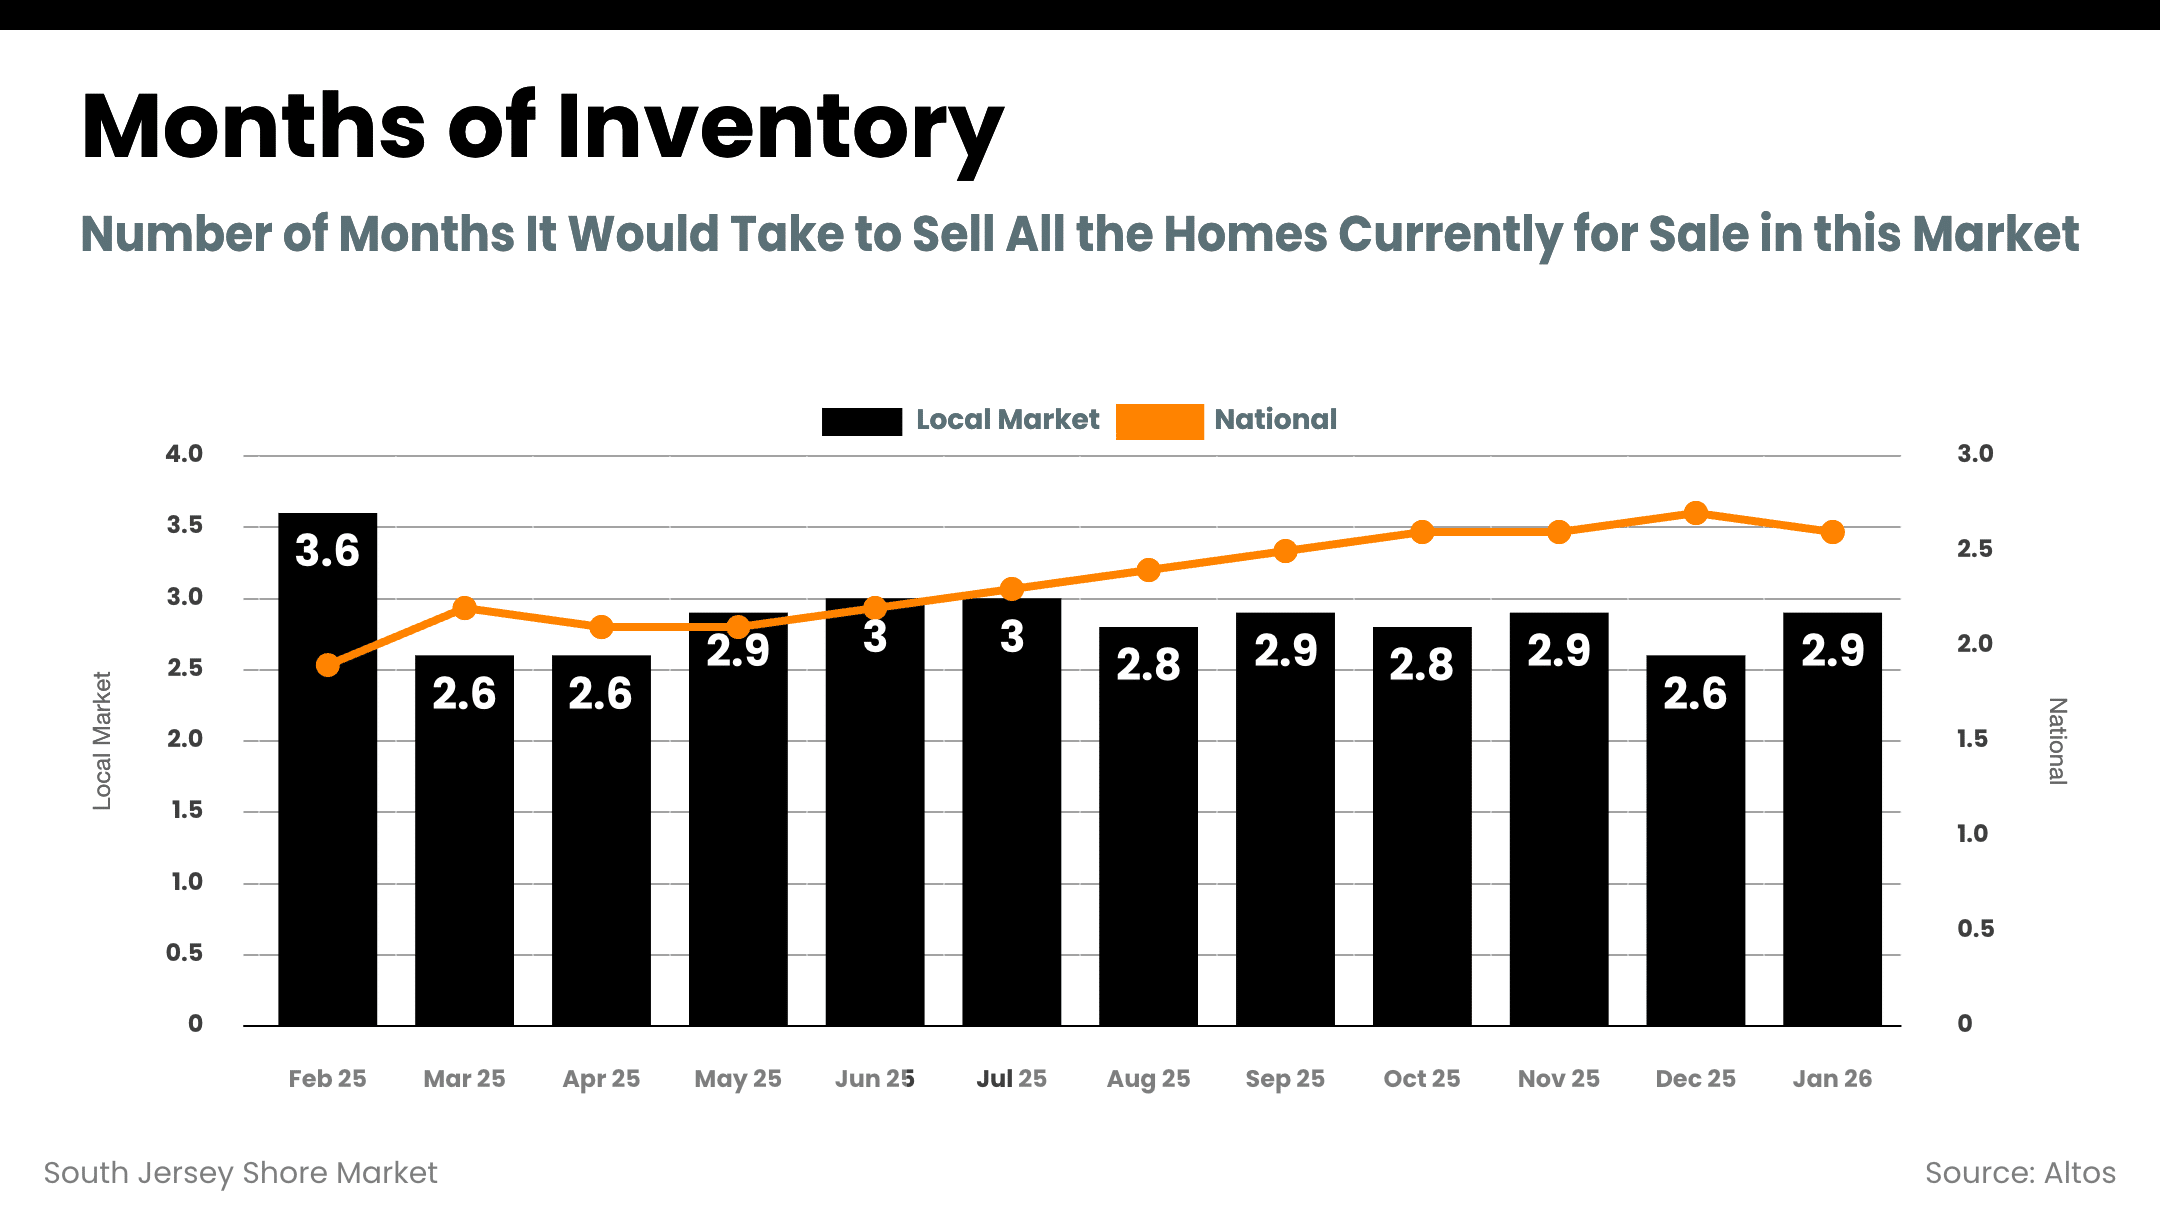
- Months of inventory: 3.84
- New listings: 507 (median list price $409K)
- Active listings: 1,274 (median list price $399.9K)
- New pending listings: 200 (median list price $383.9K; median 35 days)
- Sold listings: 187 (median sold price $395K; median 35 days; sold-to-list 96.4%)
Cape May County (January 2026)
- Months of inventory: 3.48
- New listings: 277 (median list price $775K)
- Active listings: 861 (median list price $779K)
- New pending listings: 154 (median list price $787.5K; median 55 days)
- Sold listings: 192 (median sold price $812K; median 37 days; sold-to-list 97.34%)
South Jersey Shore combined totals (Atlantic + Cape May, RPR counts)
If we simply add the county totals from the MLS/RPR snapshots (counts only):
- New listings: 507 + 277 = 784
- Active listings: 1,274 + 861 = 2,135
- New pending listings: 200 + 154 = 354
- Sold listings: 187 + 192 = 379
Note: prices, days on market, and ratios should be interpreted at the county level (and by property type/price tier), because medians and percentages do not combine cleanly without the underlying distribution data.
What This Means for Buyers on the South Jersey Shore
- Affordability is improving, but inventory still matters. The national direction is better affordability, and locally we’re seeing seasonal listing growth. The practical advantage for buyers right now is often less competition than peak season, while still having options across both counties.
- Know your county dynamics. Atlantic and Cape May are moving at different price points and timelines. In January 2026, Atlantic’s median sold price was around the mid-$300Ks, while Cape May’s median sold price was above $800K. Your strategy should reflect the specific submarket, property type, and neighborhood.
- Watch the spring “demand release.” As rates ease and buyers re-enter, well-priced homes can move quickly. If you are waiting for the “perfect rate,” run the numbers first: small rate moves can help, but the best deal is often found when negotiation leverage is still available.
What This Means for Sellers on the South Jersey Shore
- You still need pricing discipline. Even in supply-constrained environments, buyers have become more payment-sensitive. Pricing in line with today’s competition is critical, especially before spring inventory rises.
- Expect county-level differences in buyer expectations. Atlantic County’s sold-to-list ratio (mid-96% range) indicates room for negotiation, while Cape May’s ratio (high-97% range) suggests strong buyer intent when a home is positioned correctly.
- Prepare for a more active second quarter. Nationally, pending sales and purchase demand tend to respond when rates drift down. If 2026 continues on the “gradual improvement” track, sellers who are market-ready early can benefit from the first wave of spring demand.
Policy and Practical Transaction Note: Flood Insurance Stability
One practical headline for coastal markets: a federal spending package signed in early February 2026 included a reauthorization of the National Flood Insurance Program (NFIP) through September 30. For shore-area transactions, continuity and predictability around flood insurance availability matters for financing, closing timelines, and buyer confidence.
Bottom Line for February 2026
Nationally, inventory is higher than last year, but the recovery has cooled. Mortgage-rate relief is improving affordability and helping bring demand back incrementally. Locally, the South Jersey Shore remains a supply-constrained market overall, with seasonal listing momentum and county-level differences that matter.
Frequently Asked Questions
Is the South Jersey Shore market a buyer’s market or seller’s market right now?
Based on January 2026 MLS/RPR snapshots, months of inventory were about 3.84 in Atlantic County and 3.48 in Cape May County, which generally reads as a more balanced market than the ultra-tight conditions of prior years, but still not a high-inventory environment.
Are prices dropping locally?
Pricing is mixed by county and segment. In January 2026, Atlantic County’s median sold price was $395K, while Cape May County’s median sold price was $812K. The “headline” direction depends heavily on property type, location, and the comparable sales set.
Are homes taking longer to sell?
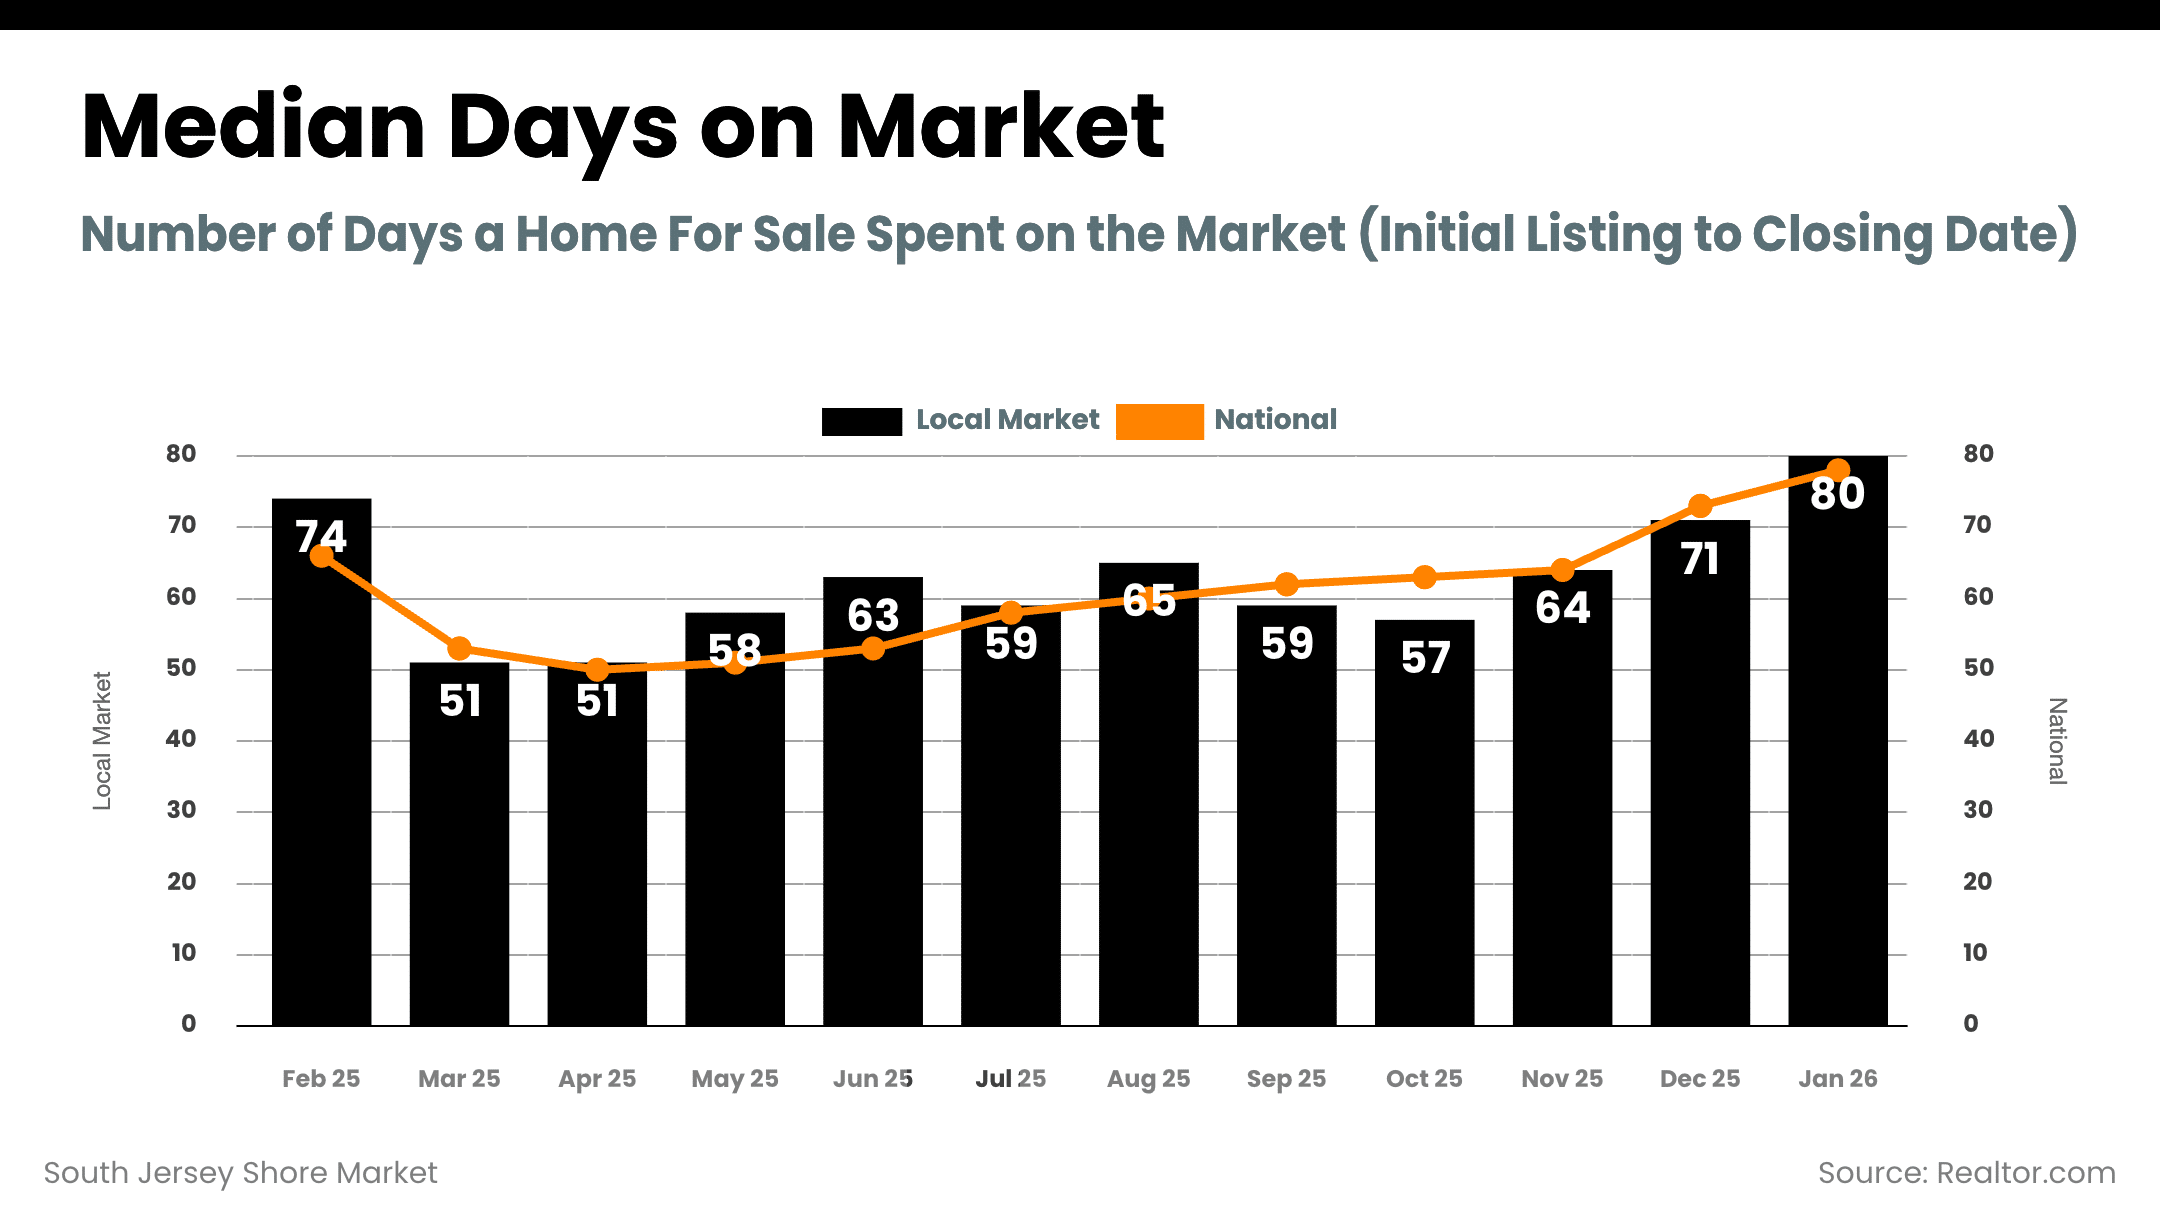
Nationally, days on market were higher year over year. Locally, January 2026 median days in RPR sold data were about 35 days in Atlantic County and 37 days in Cape May County, with pending timelines varying by county as well.
Should I wait for rates to fall further before buying?
Rates matter, but so does competition and negotiation leverage. If you are considering waiting, the best first step is to run the payment math for your price range and compare it against the negotiating environment you see today versus spring.
Why do different reports show different listing counts?
Realtor.com county metrics track inventory and activity based on listings visible on that platform, while MLS/RPR snapshots reflect MLS-based activity (SF + Condo/TH/Apt) and additional market statistics. Both are useful, but they are measuring slightly different universes of listings.
Local Area Specific Market Reports (these reports are updated every 48 hours)