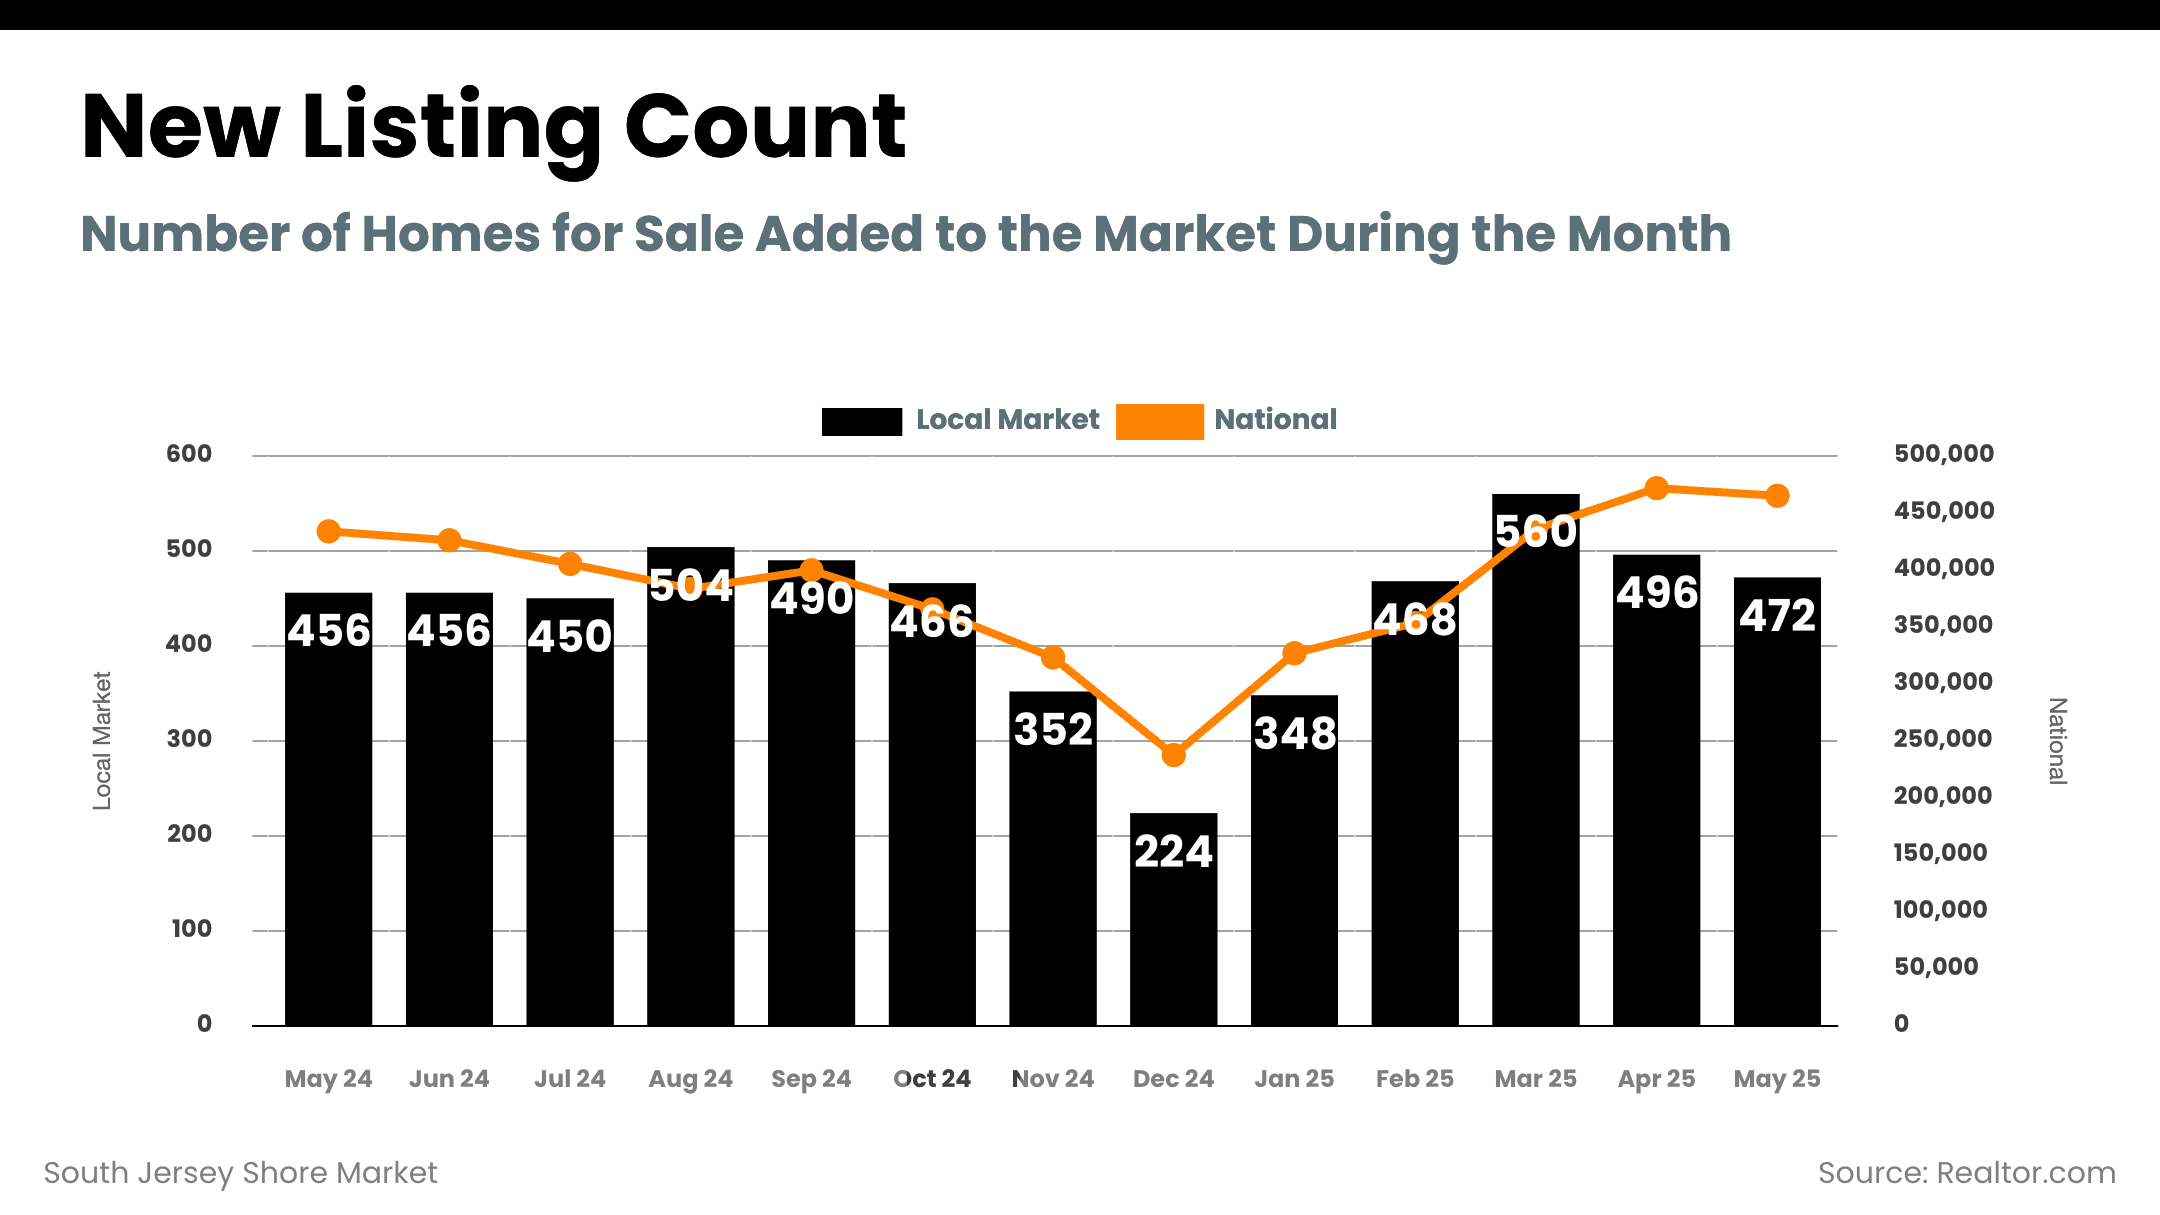
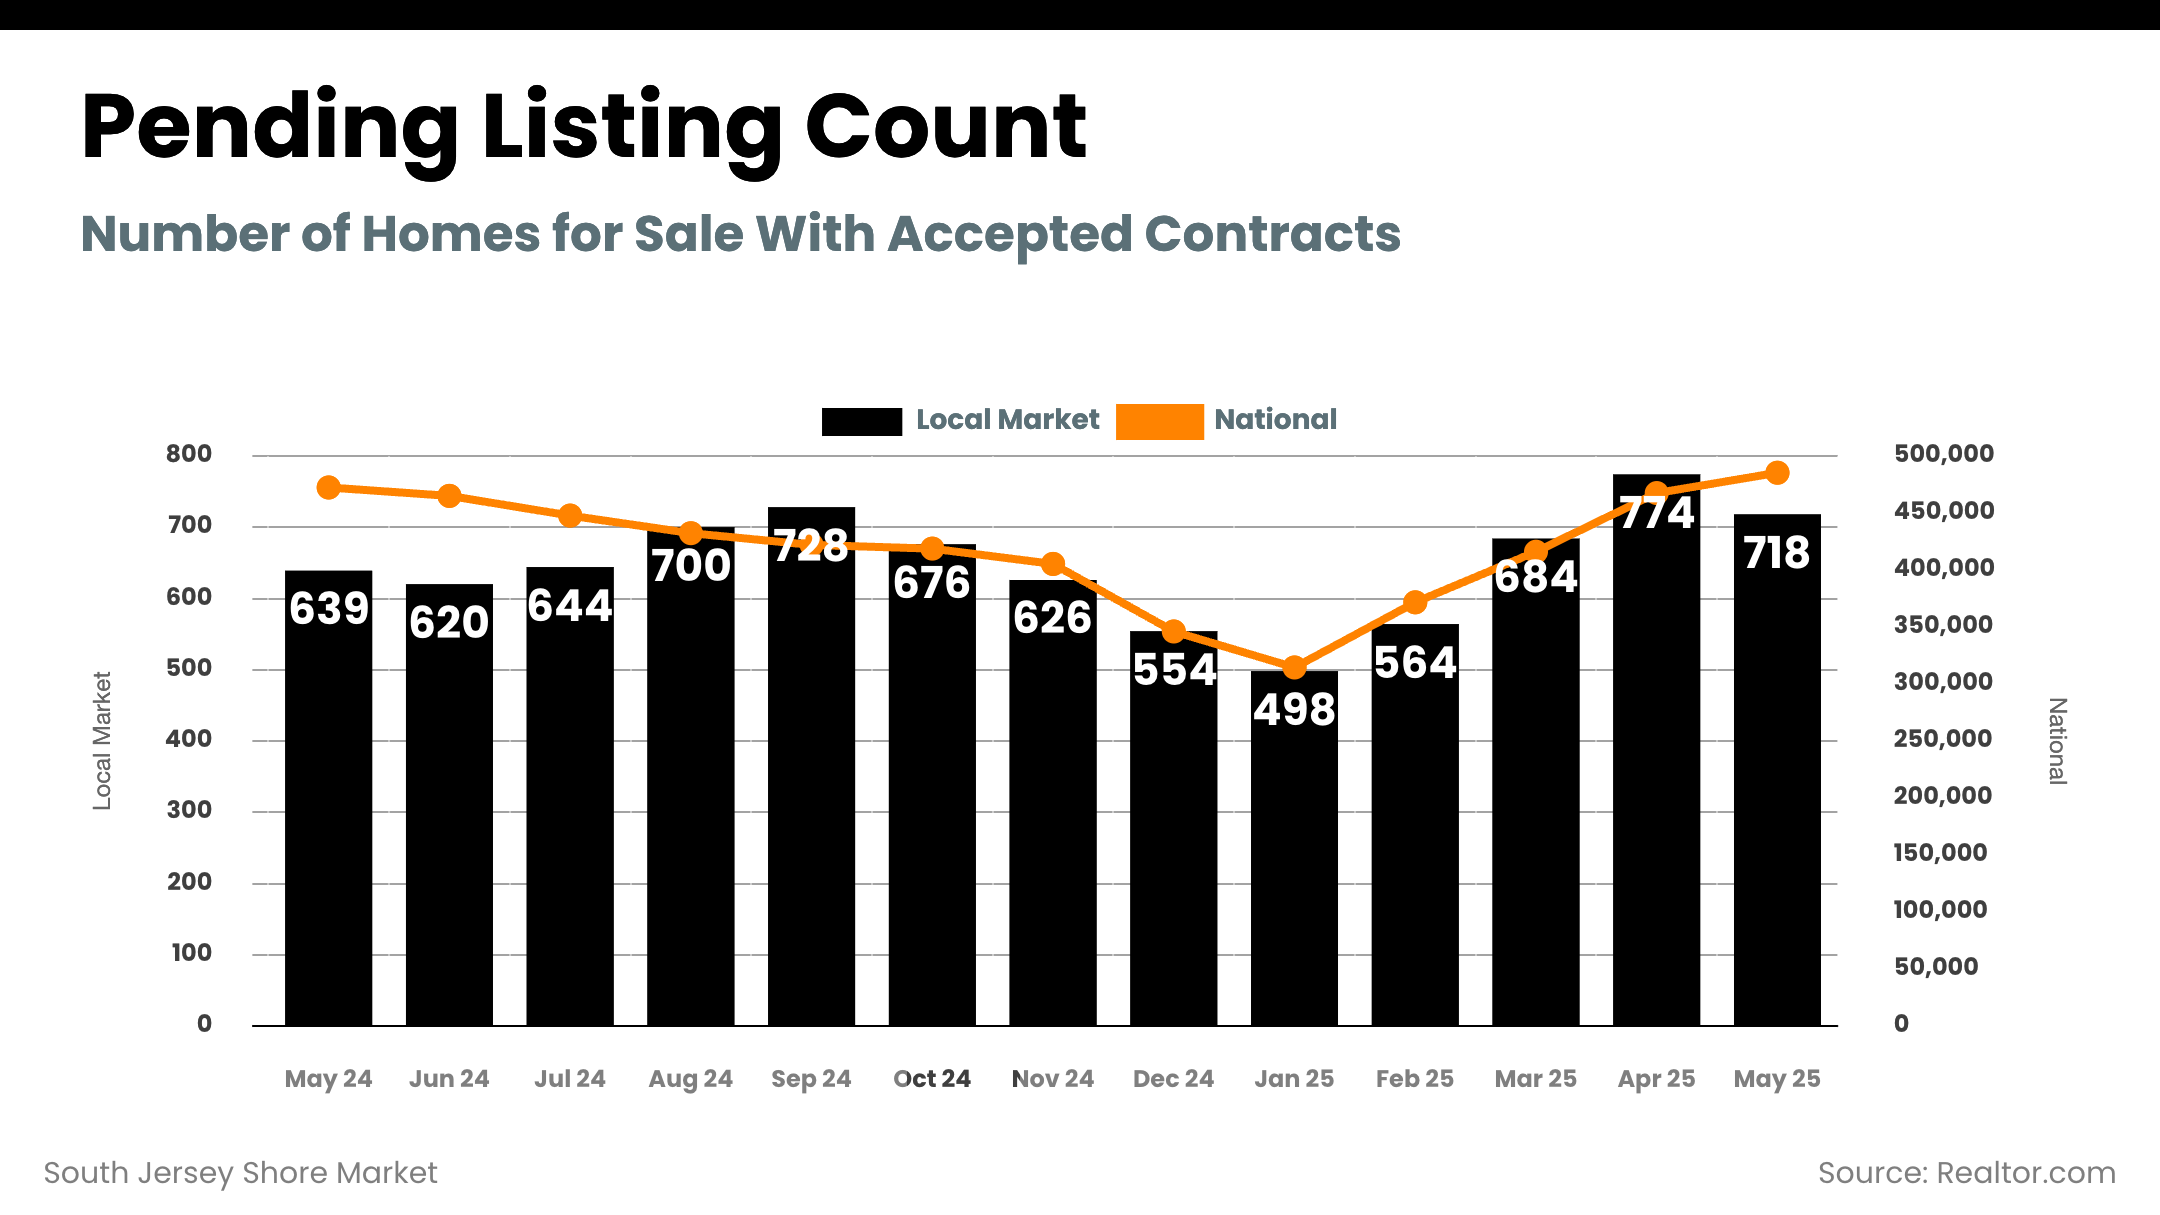
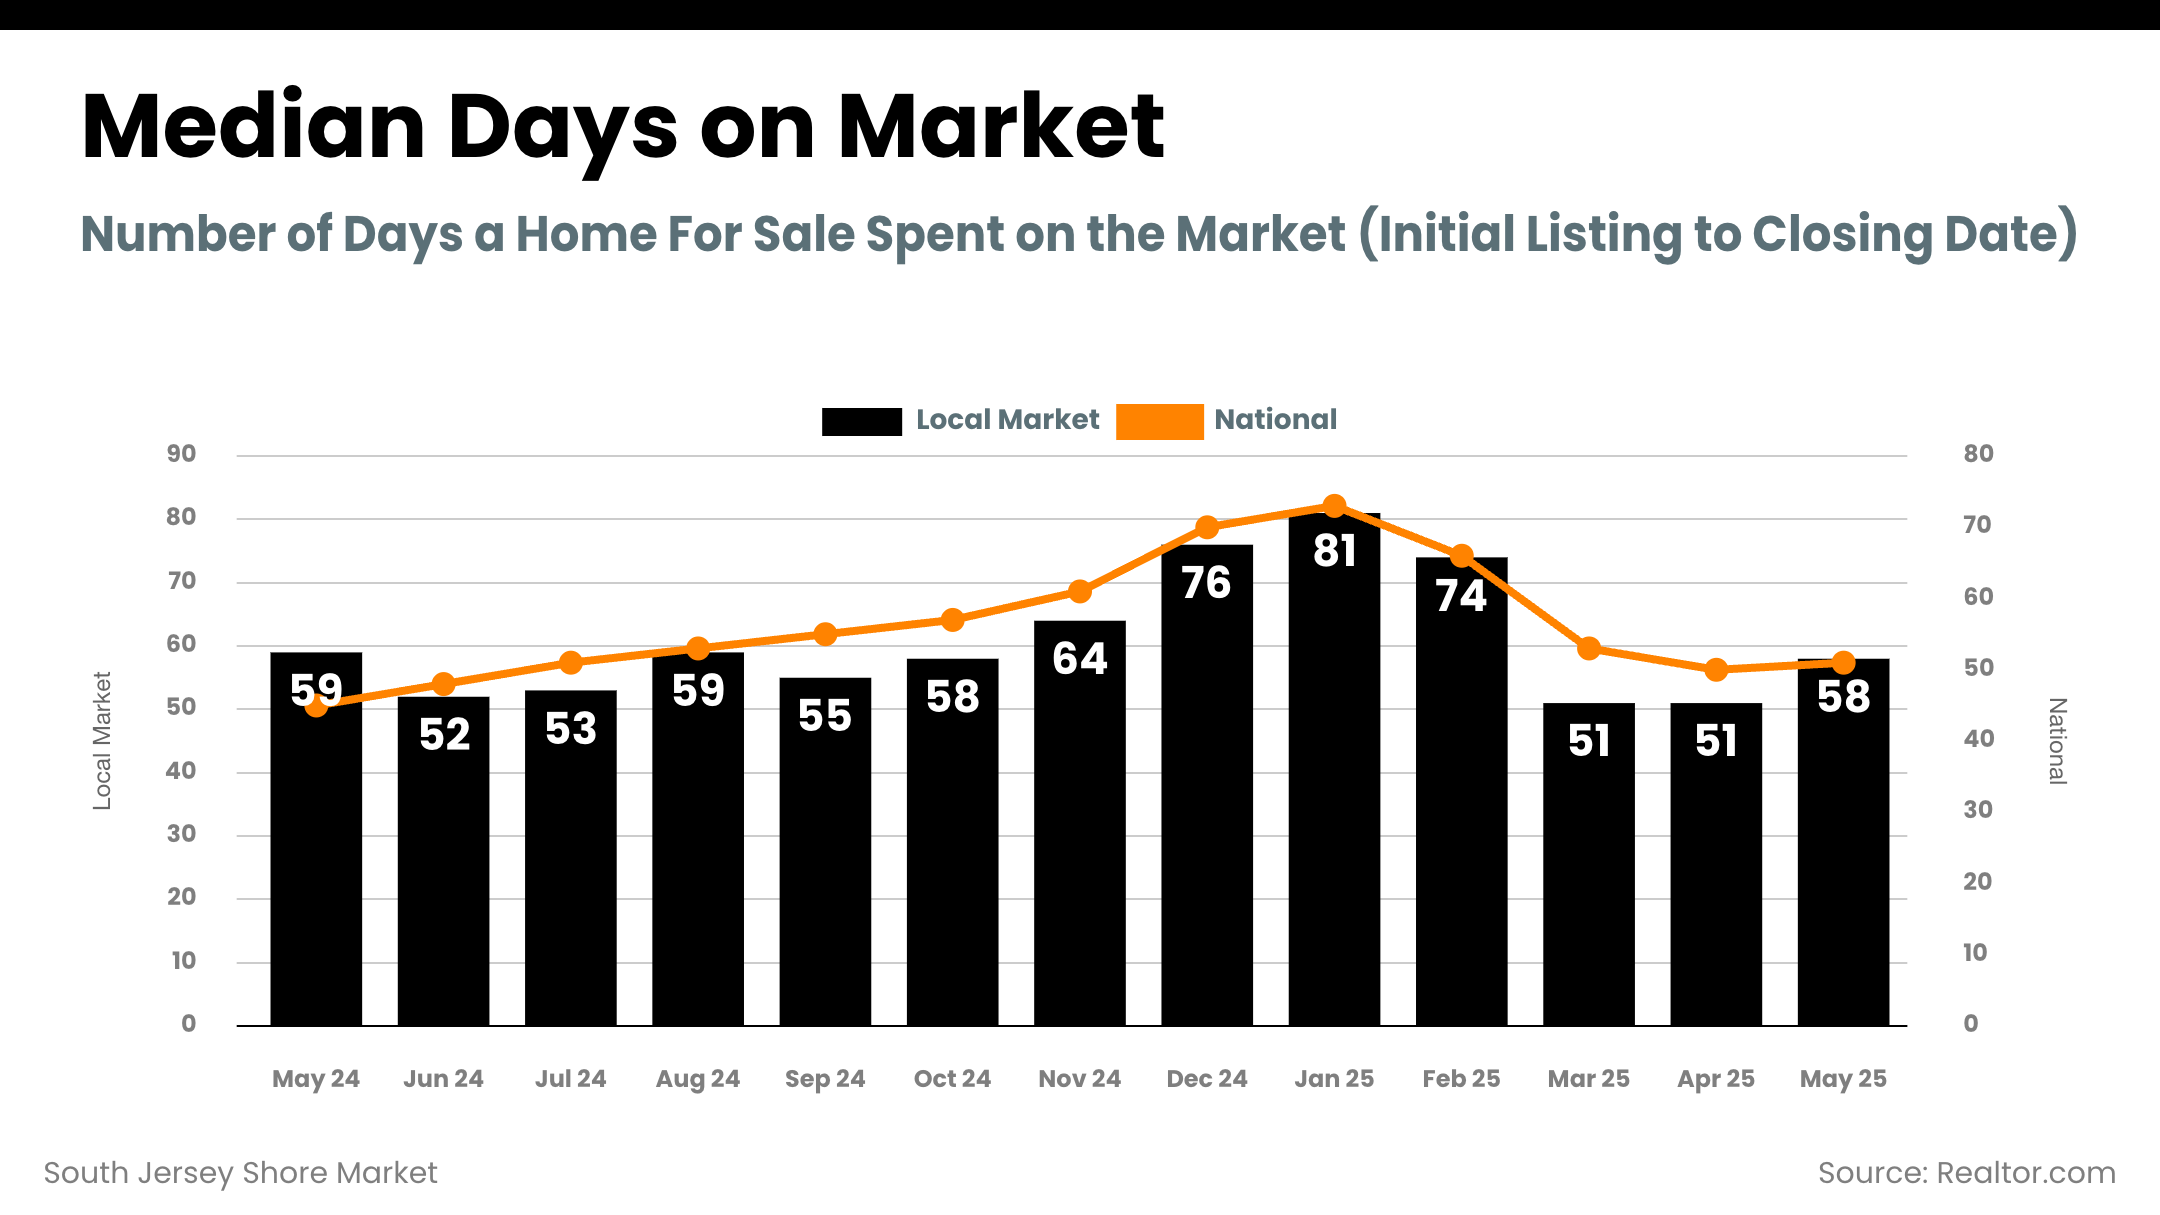
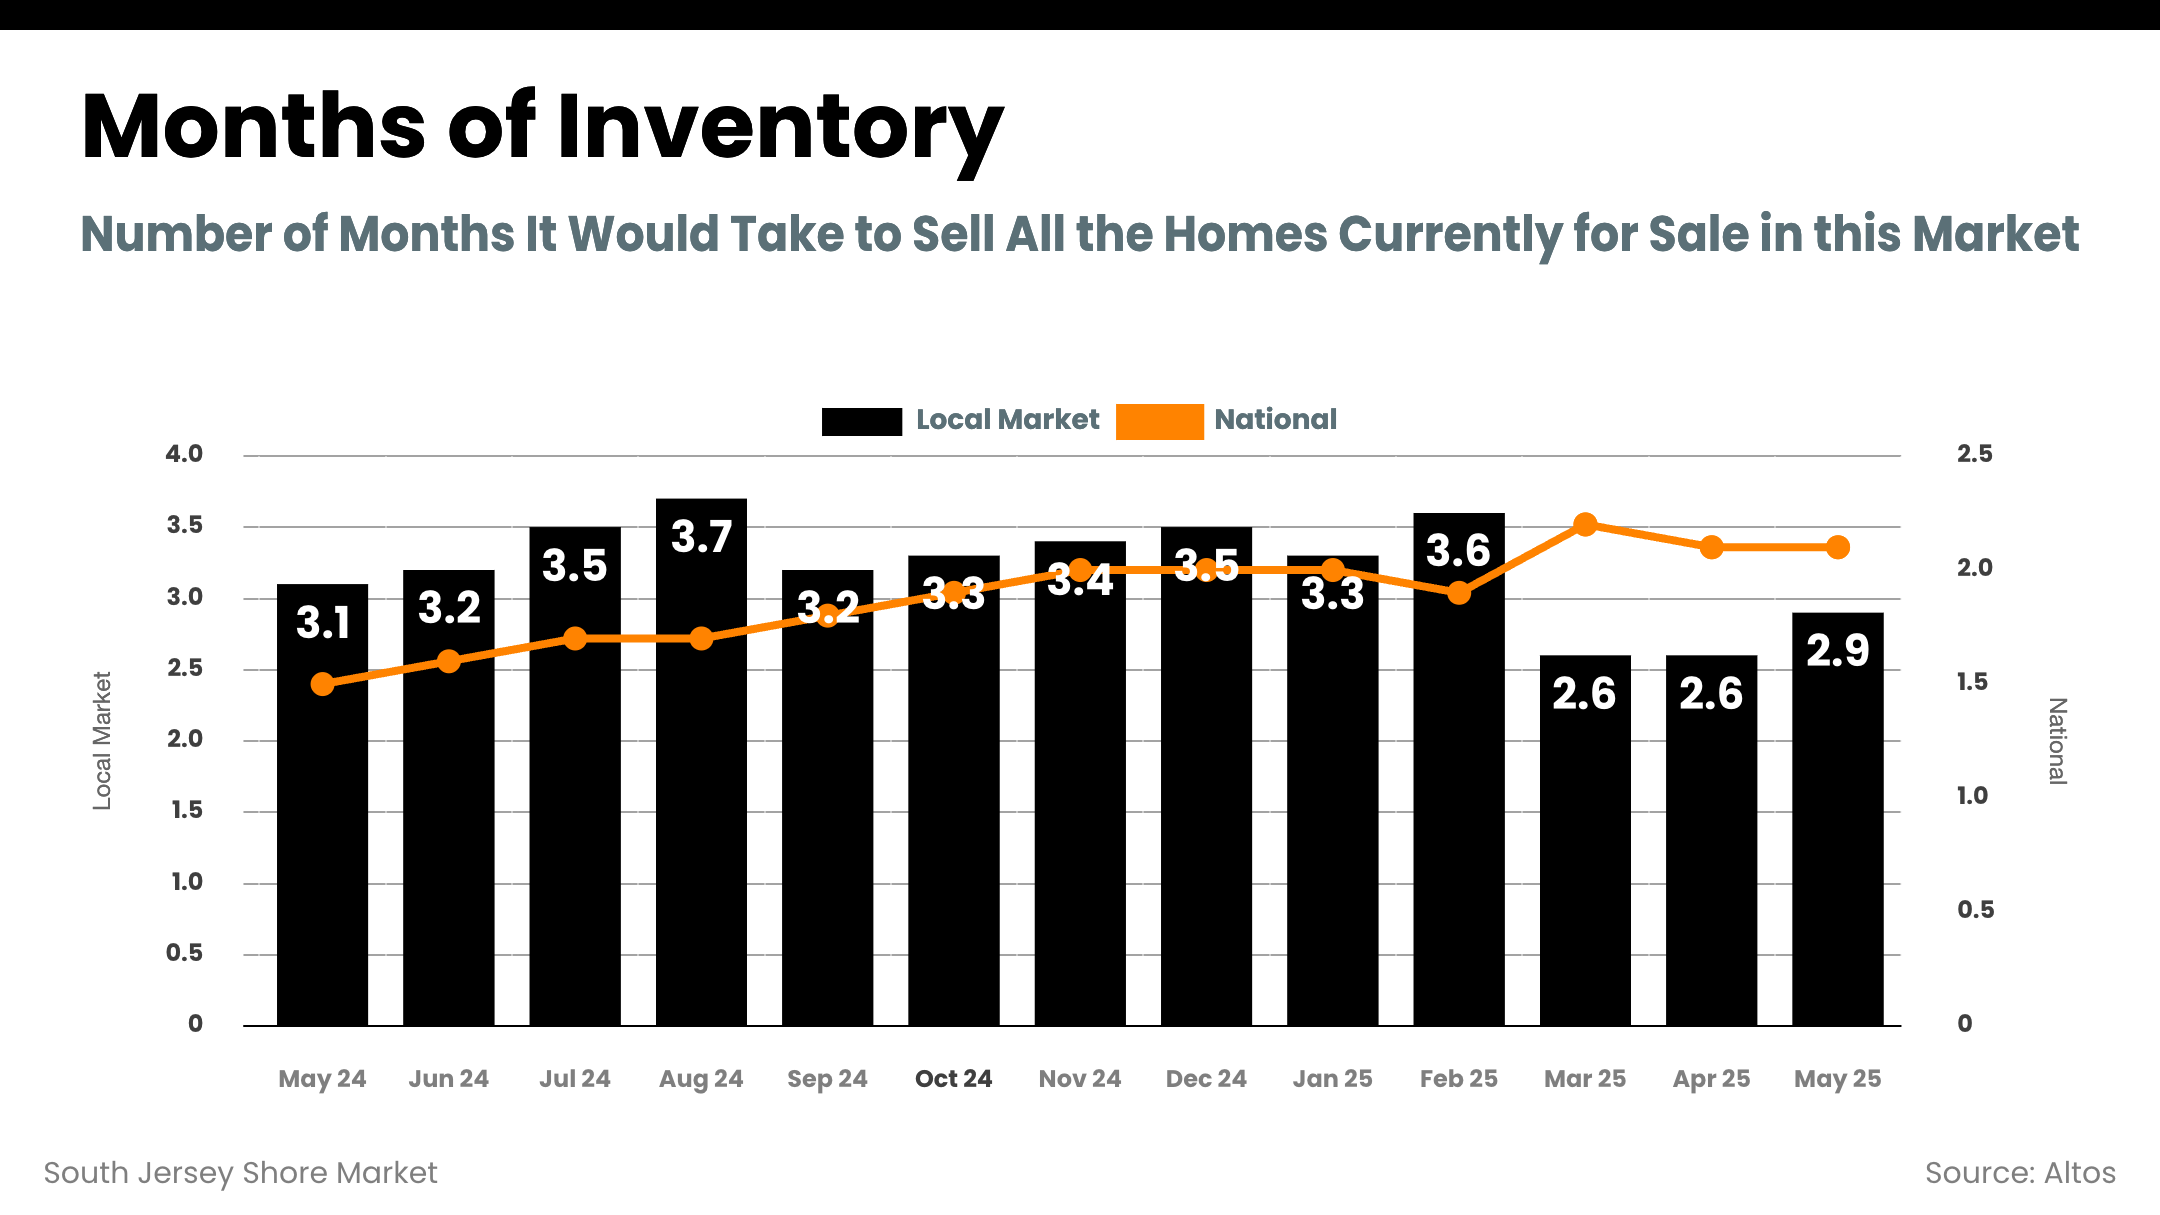
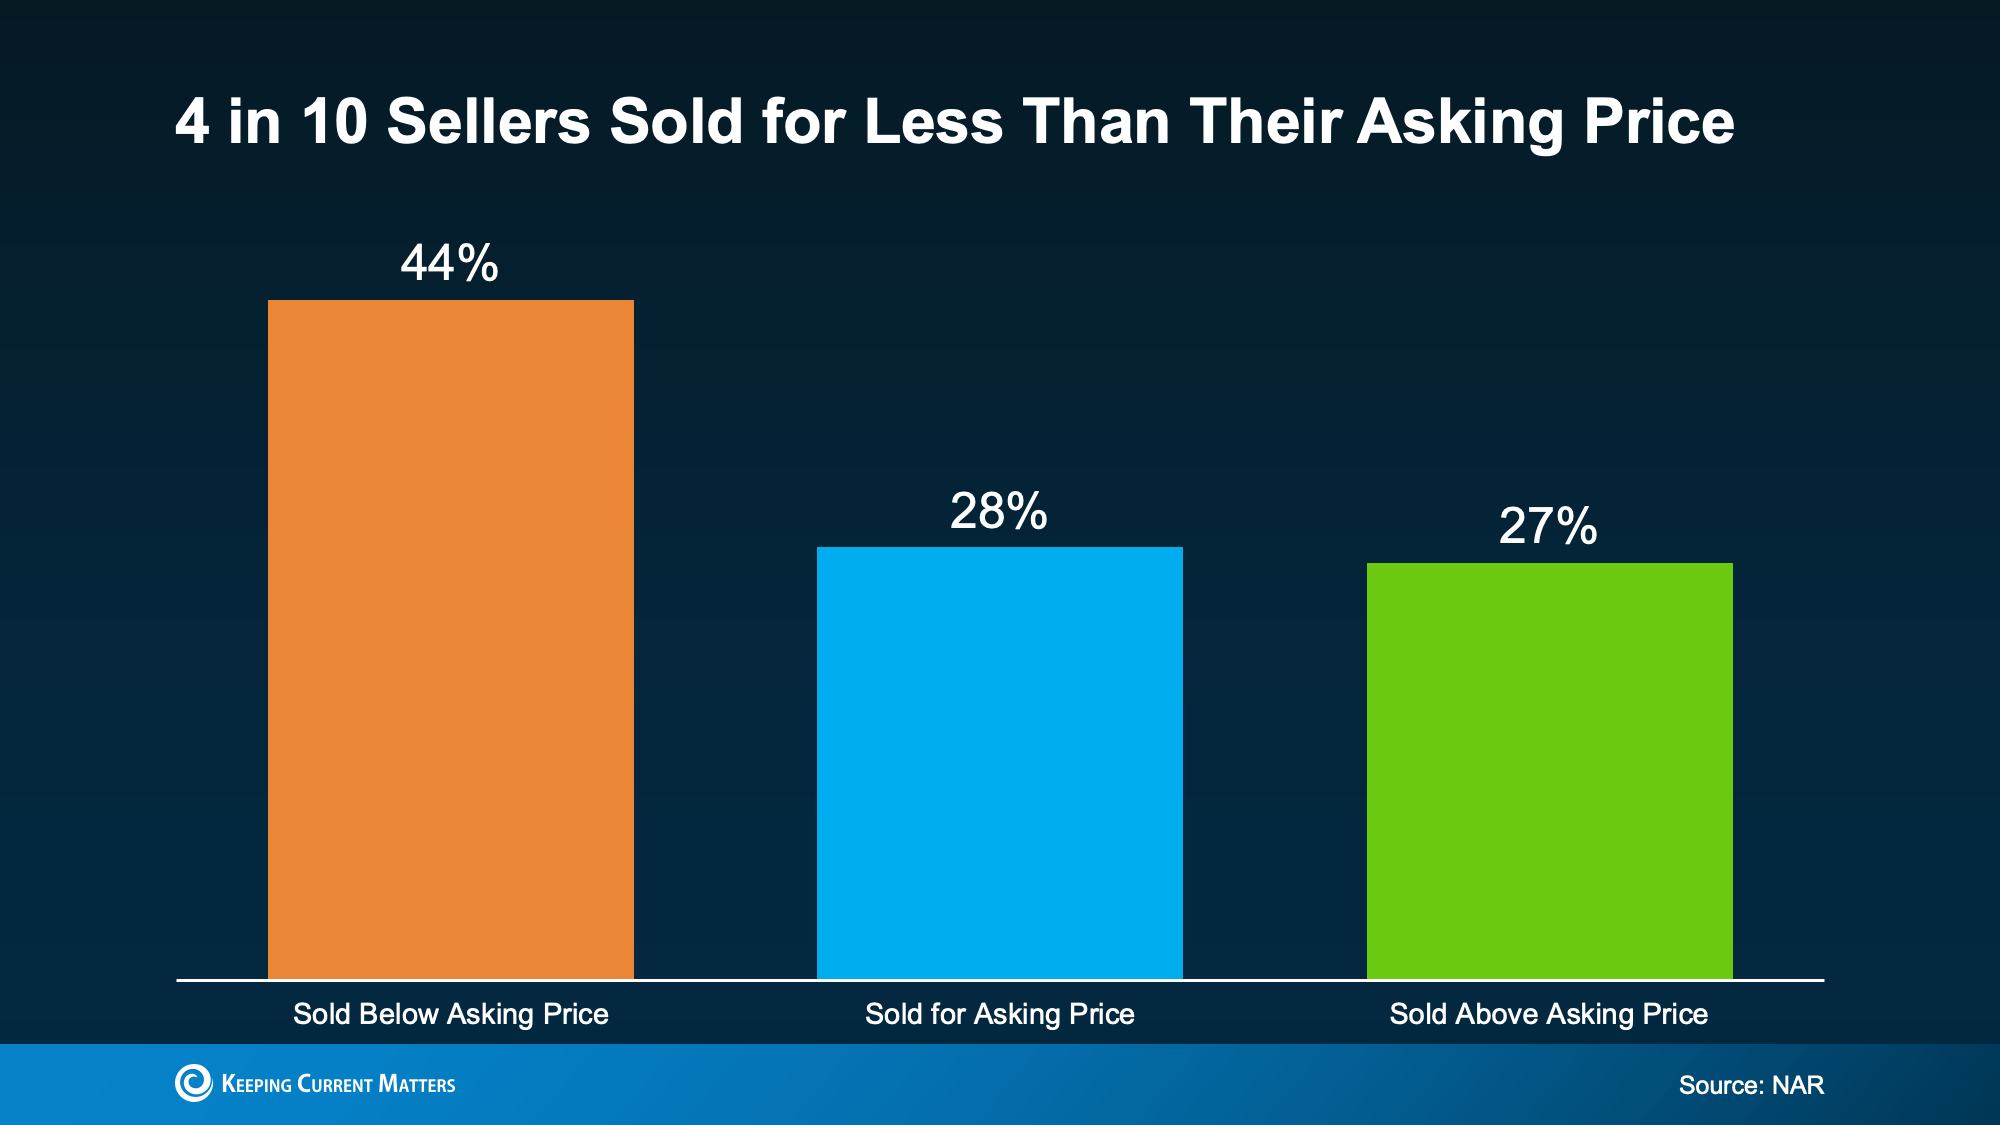
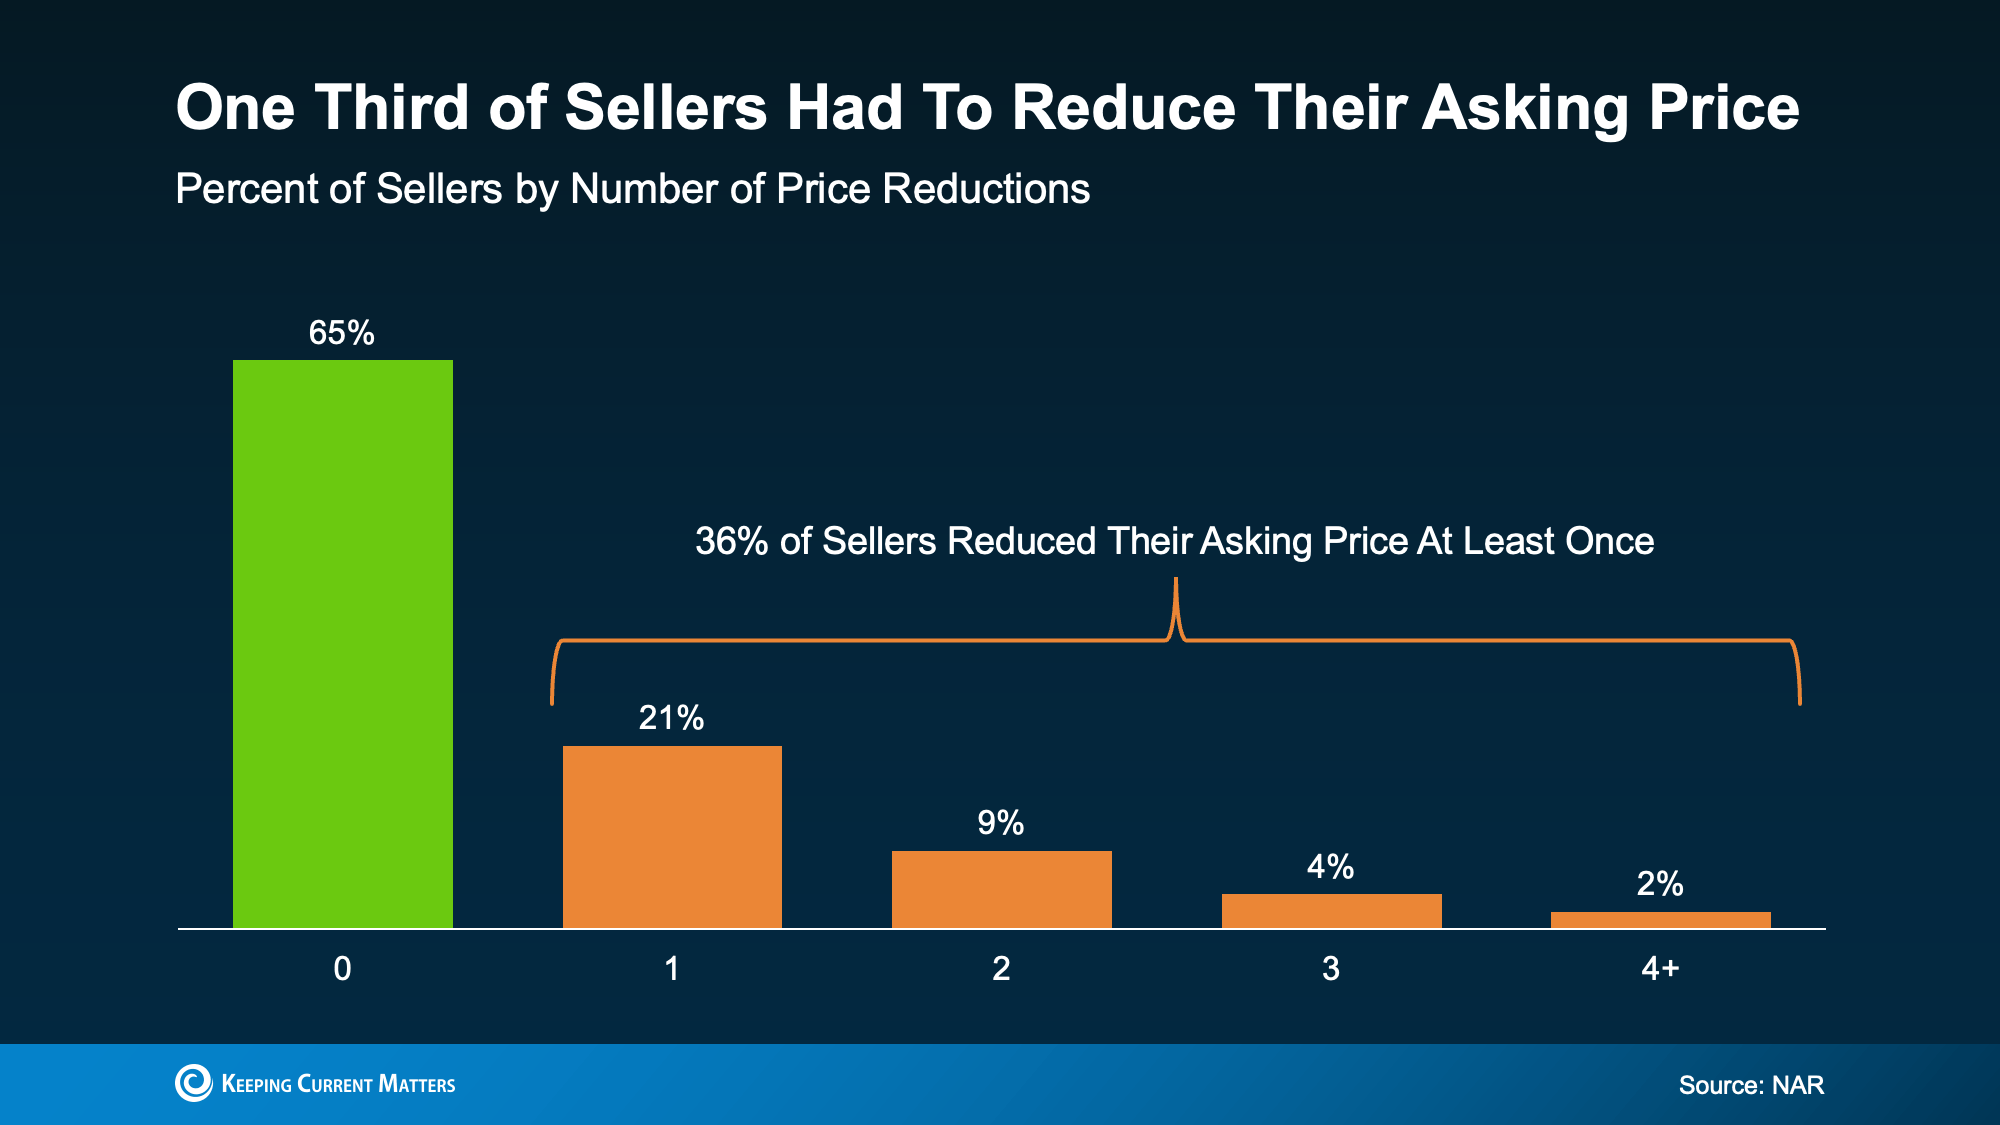
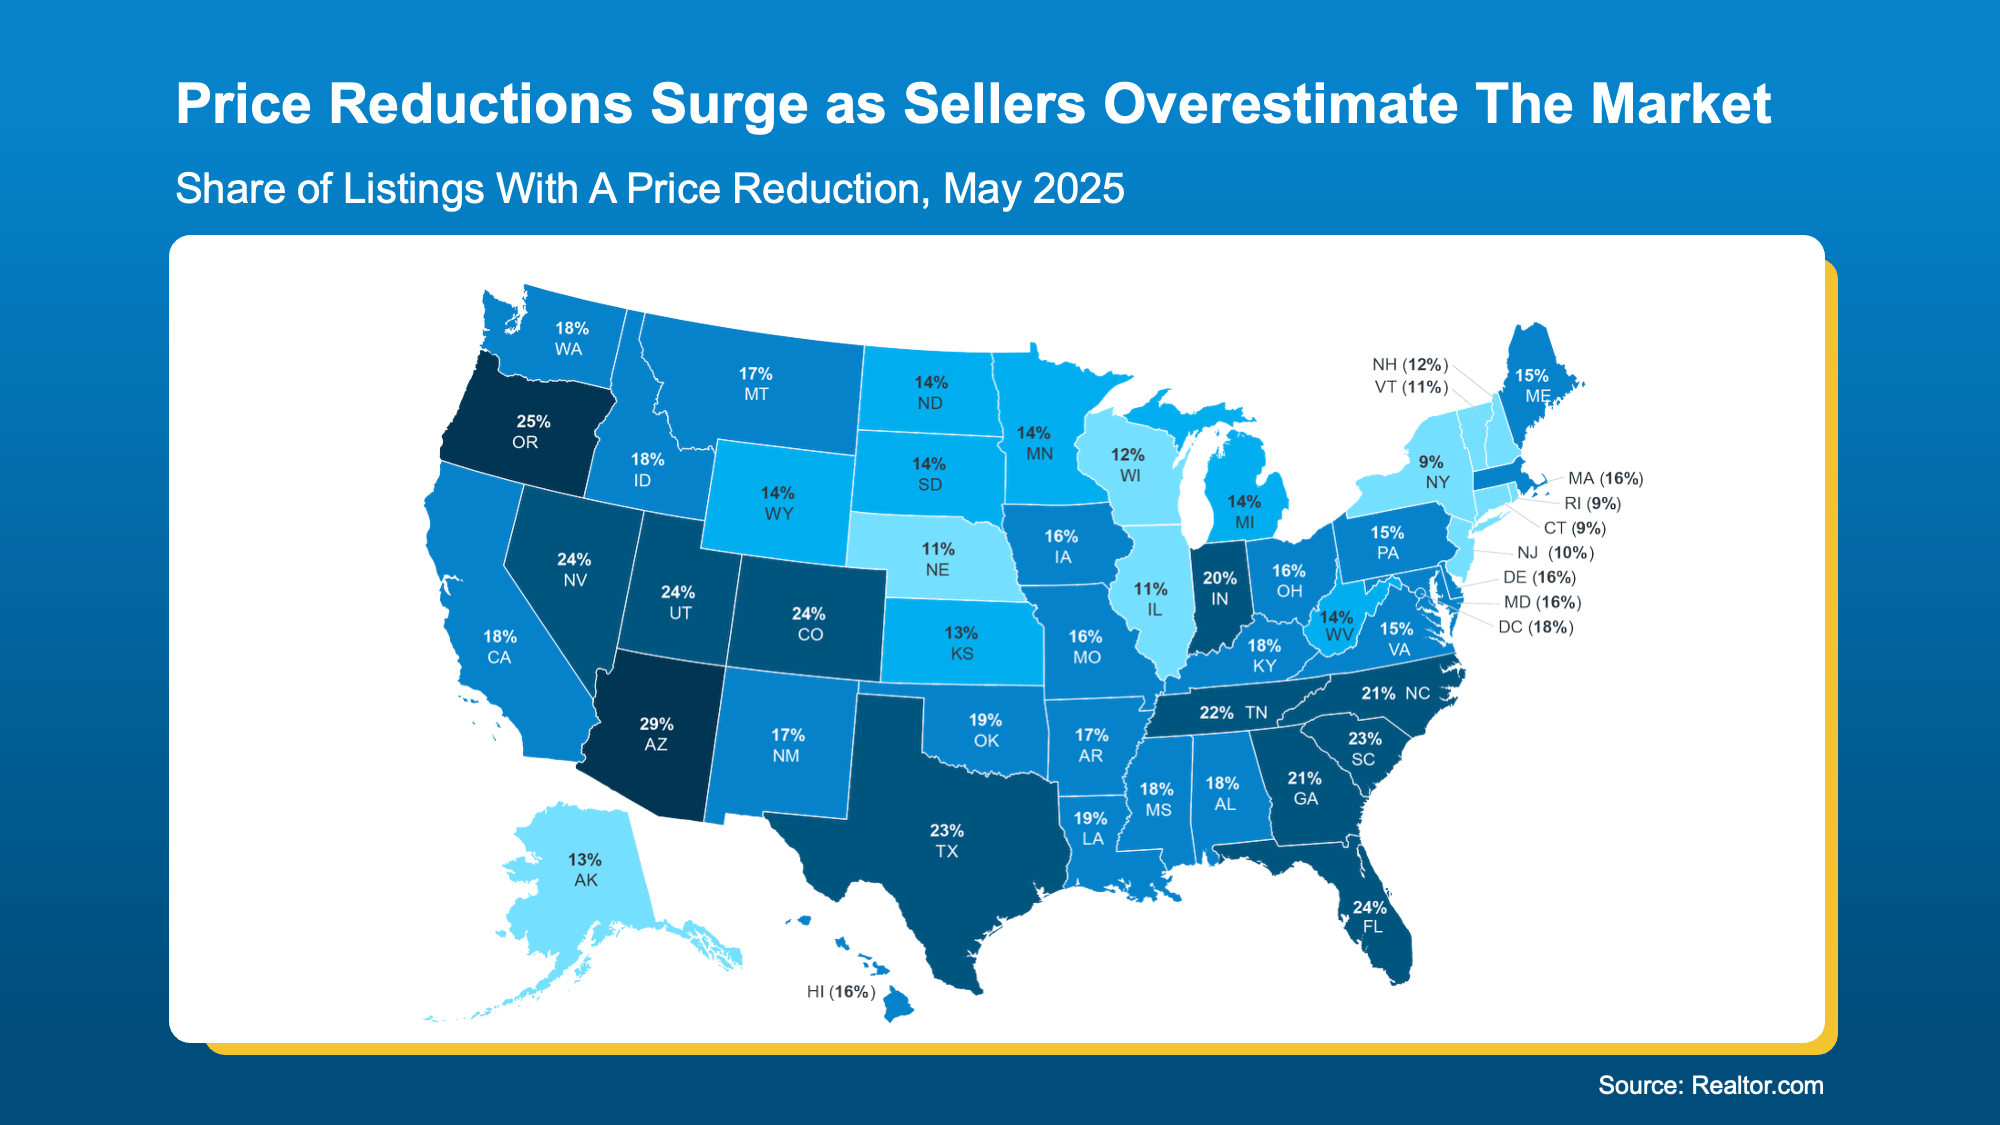

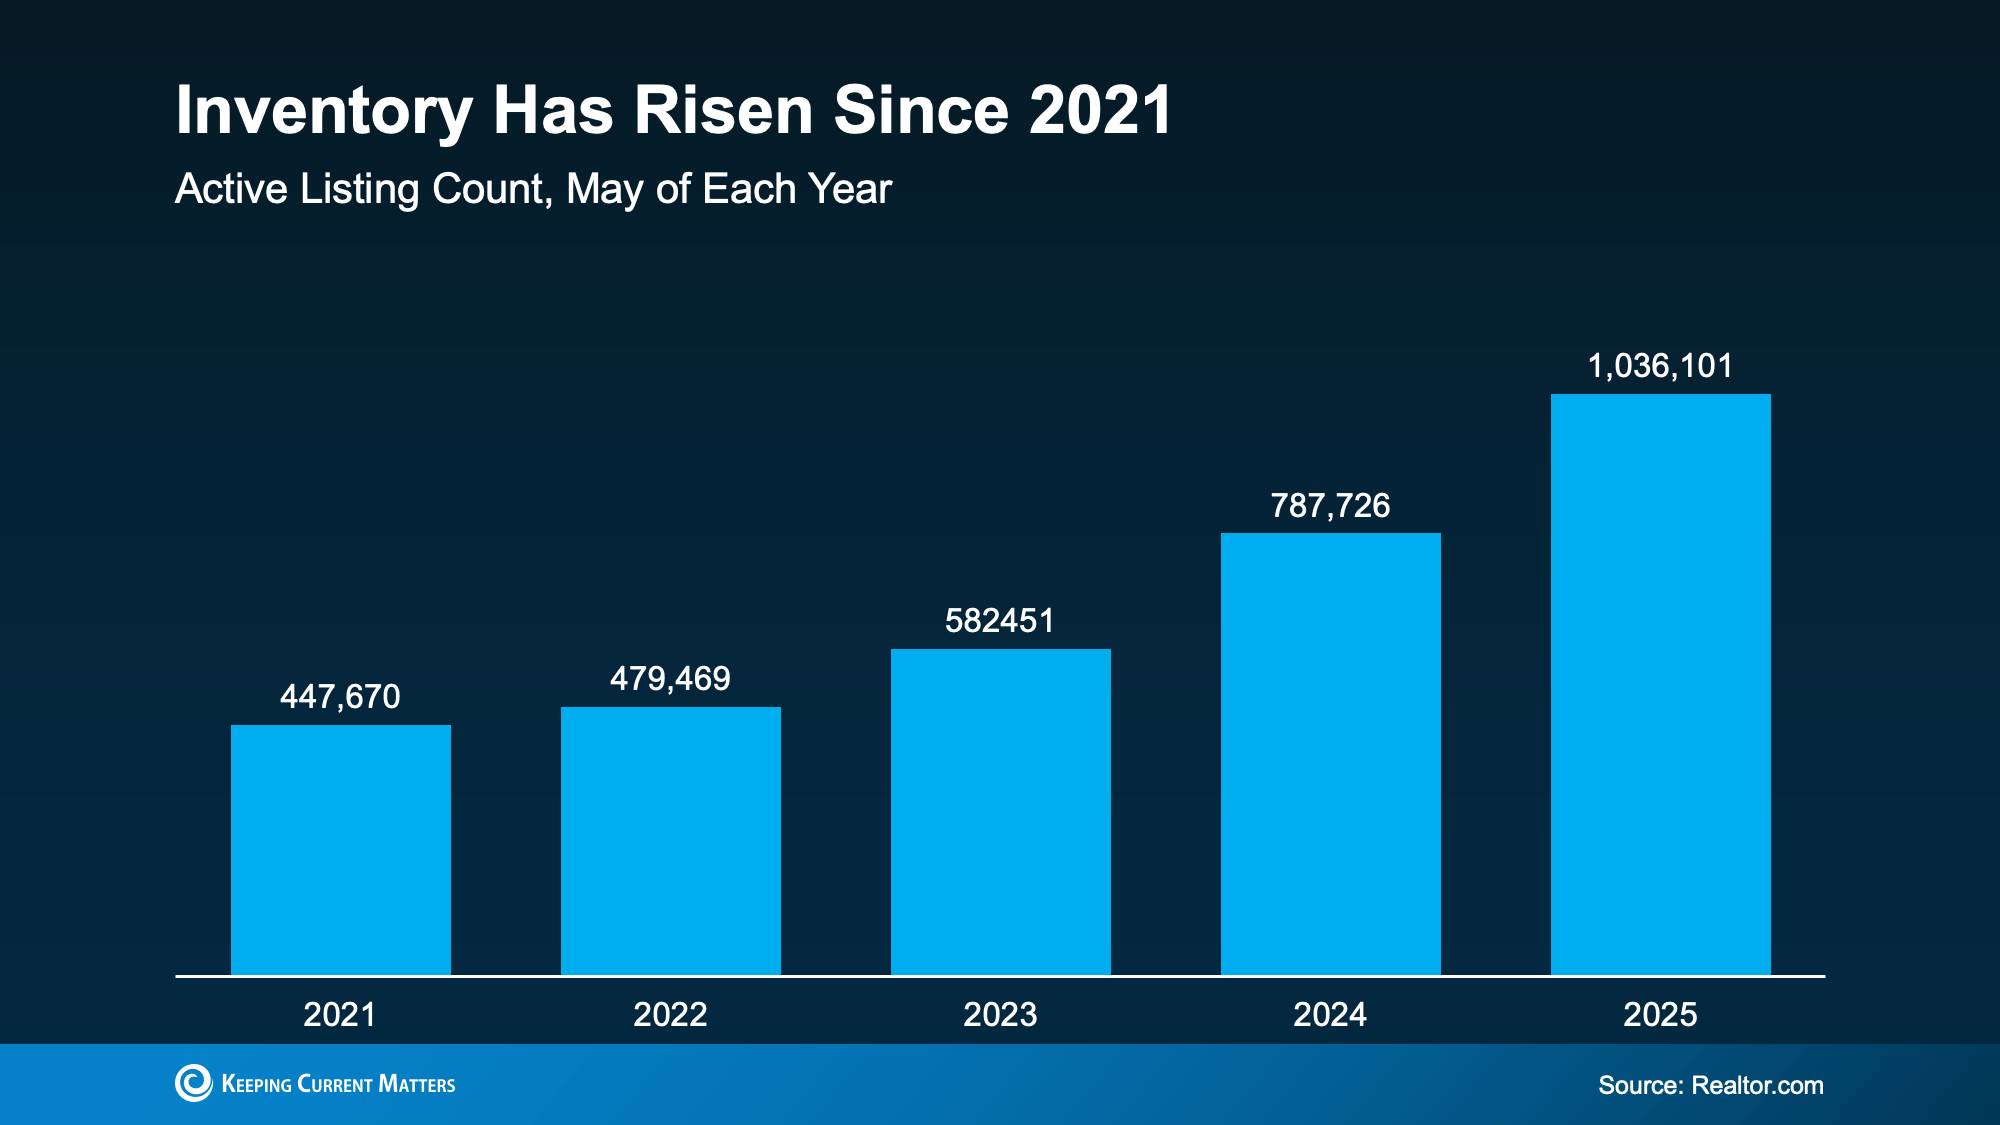
The real estate market along the South Jersey Shore continues to show strength and stability as we head into summer 2025. While the national housing market is softening—with rising inventory levels, longer days on market, and more frequent price reductions—our local markets in Cape May and Atlantic Counties tell a different story. Here, demand remains strong, homes are selling quickly, and properties continue to command prices near asking. Inventory levels are rising modestly, but not enough to shift the balance significantly. In fact, many towns across the shore are still seeing multiple-offer situations and tight competition, especially in desirable coastal locations.
National Housing Market: Shifting Toward Balance
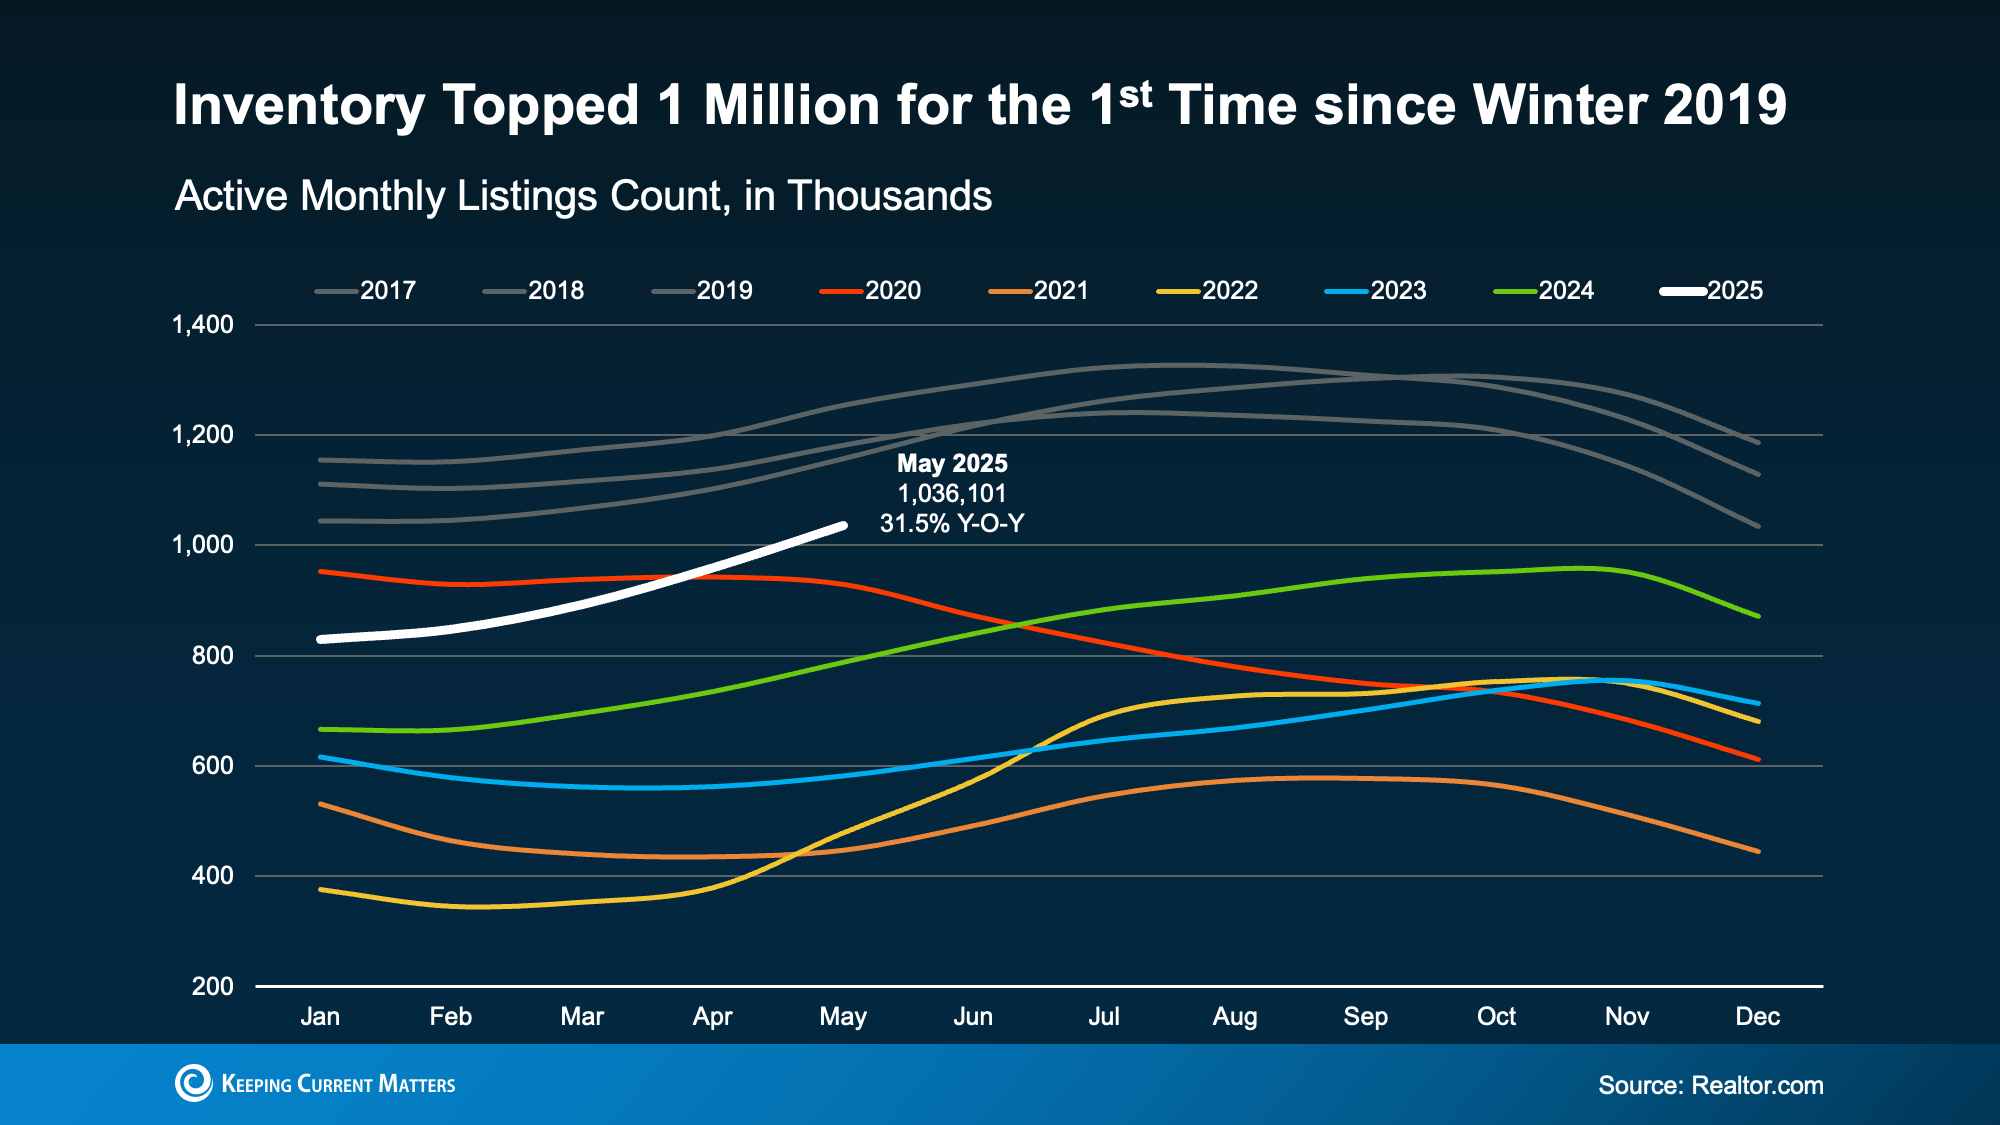
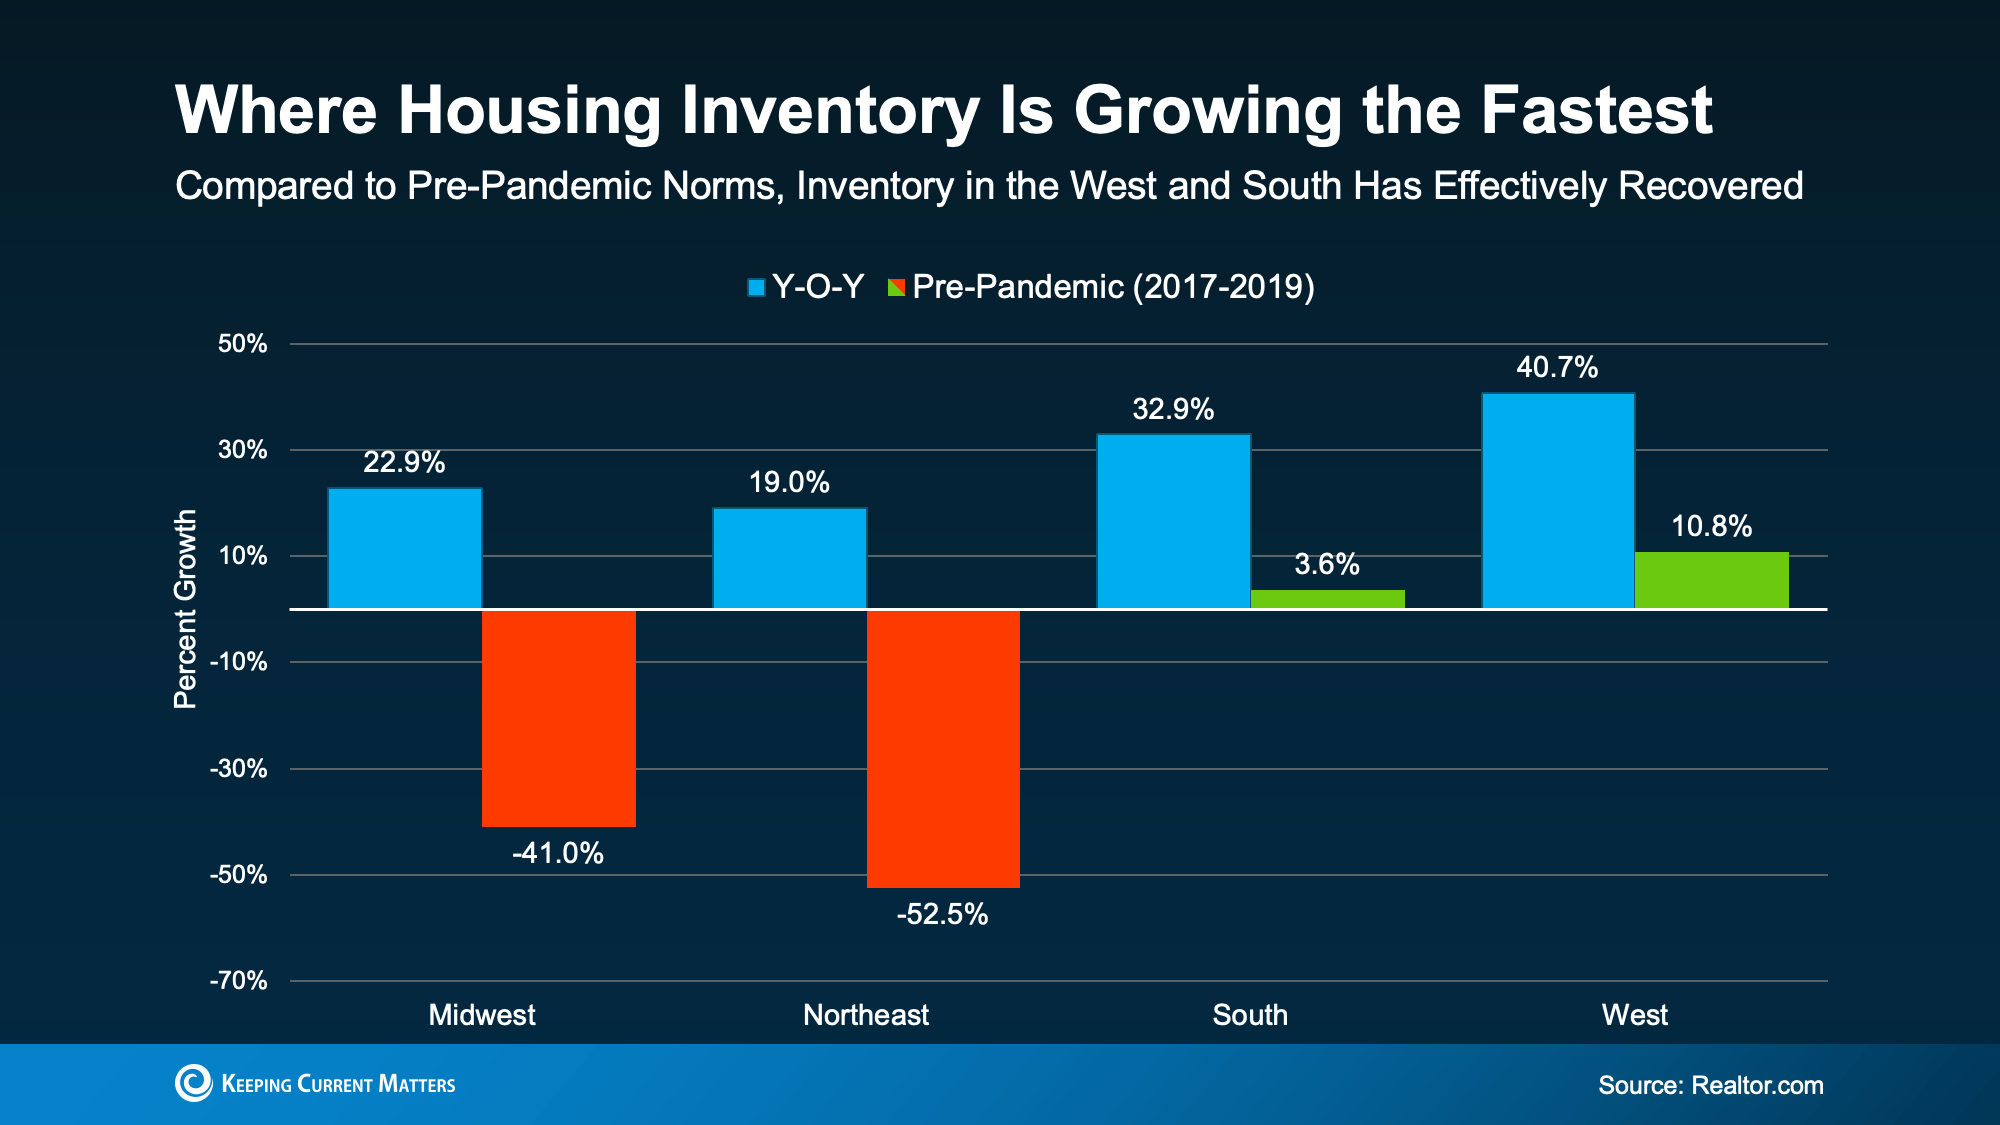
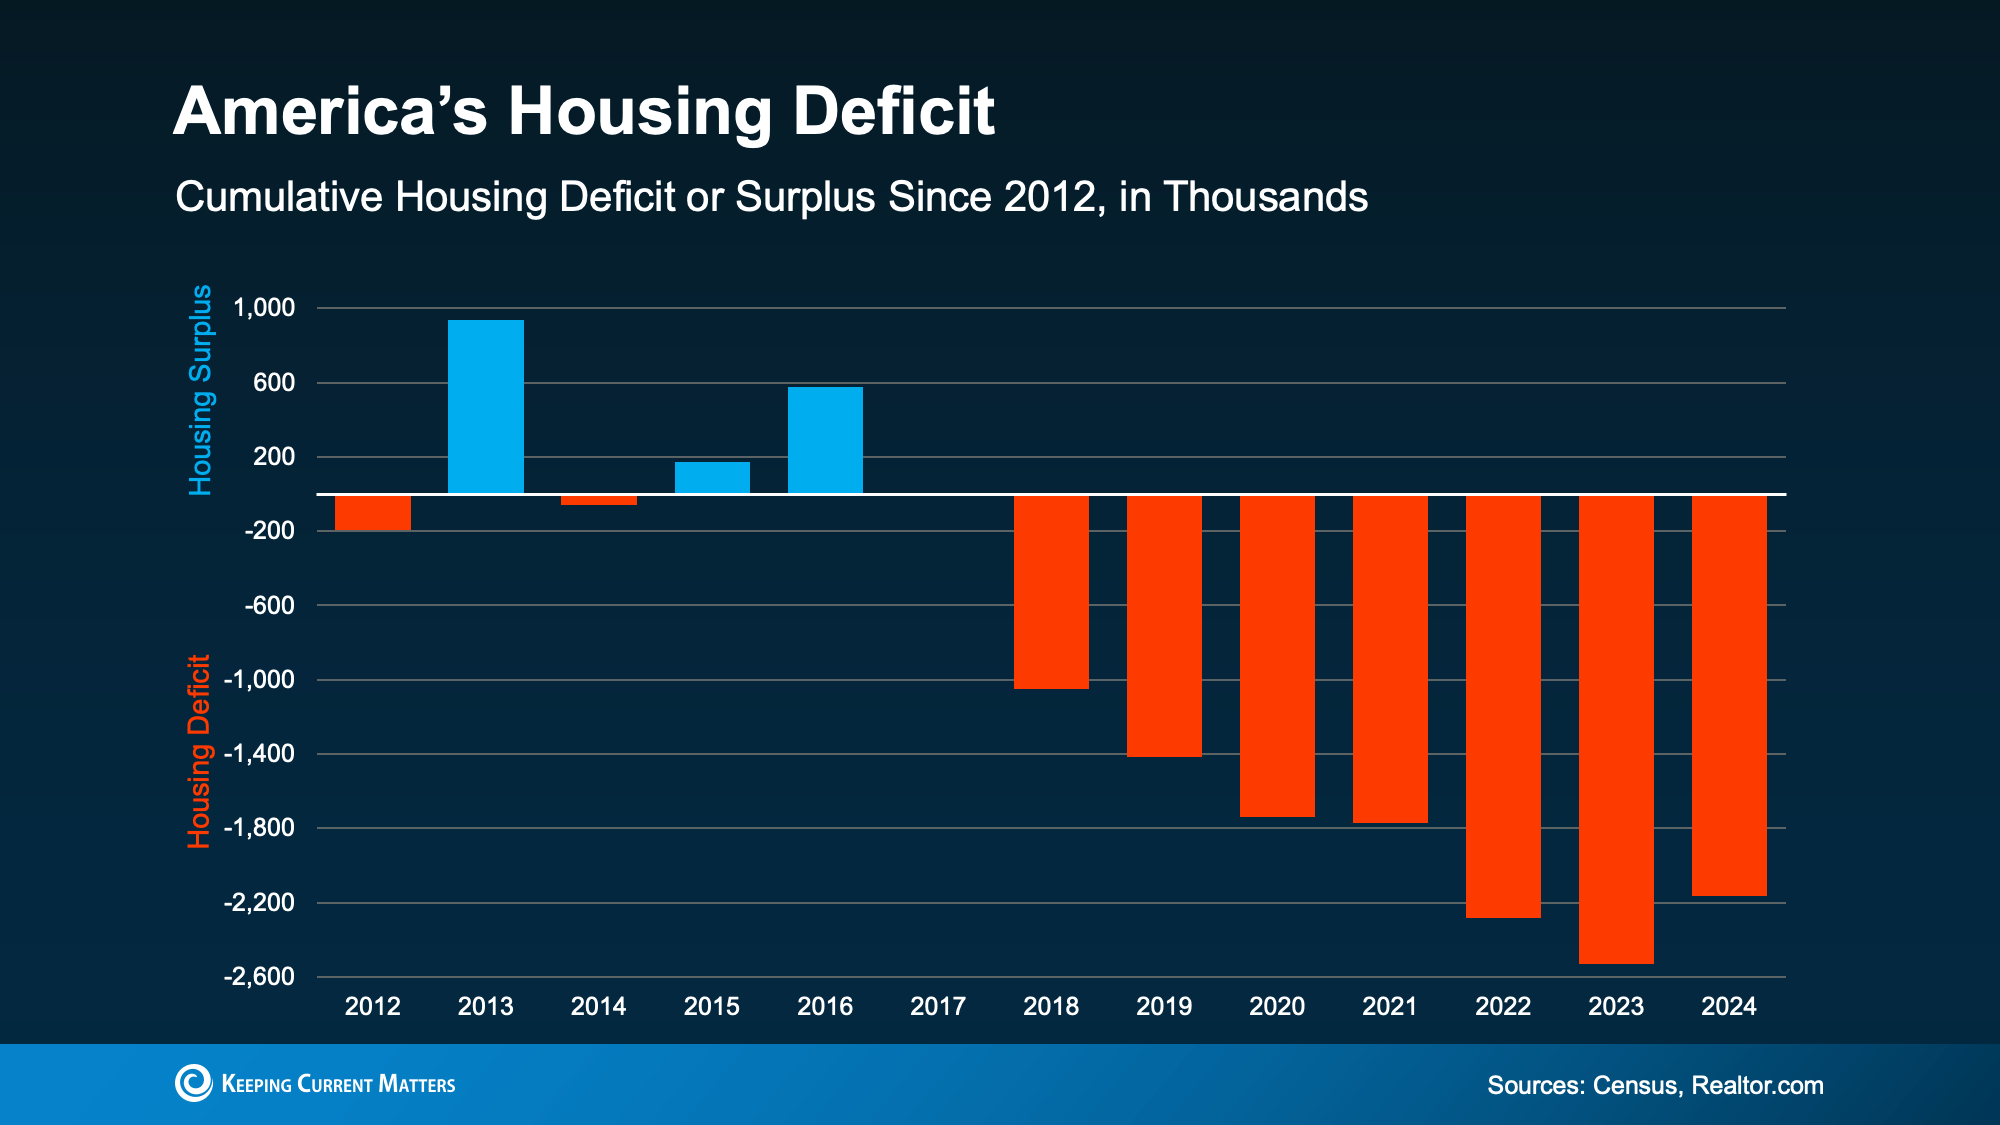
The U.S. housing market is gradually stabilizing. Active inventory has surpassed 1 million listings—something not seen since 2019. Despite this, national inventory is still 12.3% below pre-pandemic levels, highlighting persistent supply constraints.
- Mortgage rates remain in the upper 6% range.
- Expired listings or listings that do not successfully sell are up nearly 18% year-over-year.
- Price reductions are becoming more common, particularly in overheated Sun Belt markets.
With more homes available, buyers are gaining negotiating power in many regions.
South Jersey Shore Market: Competitive and Balanced
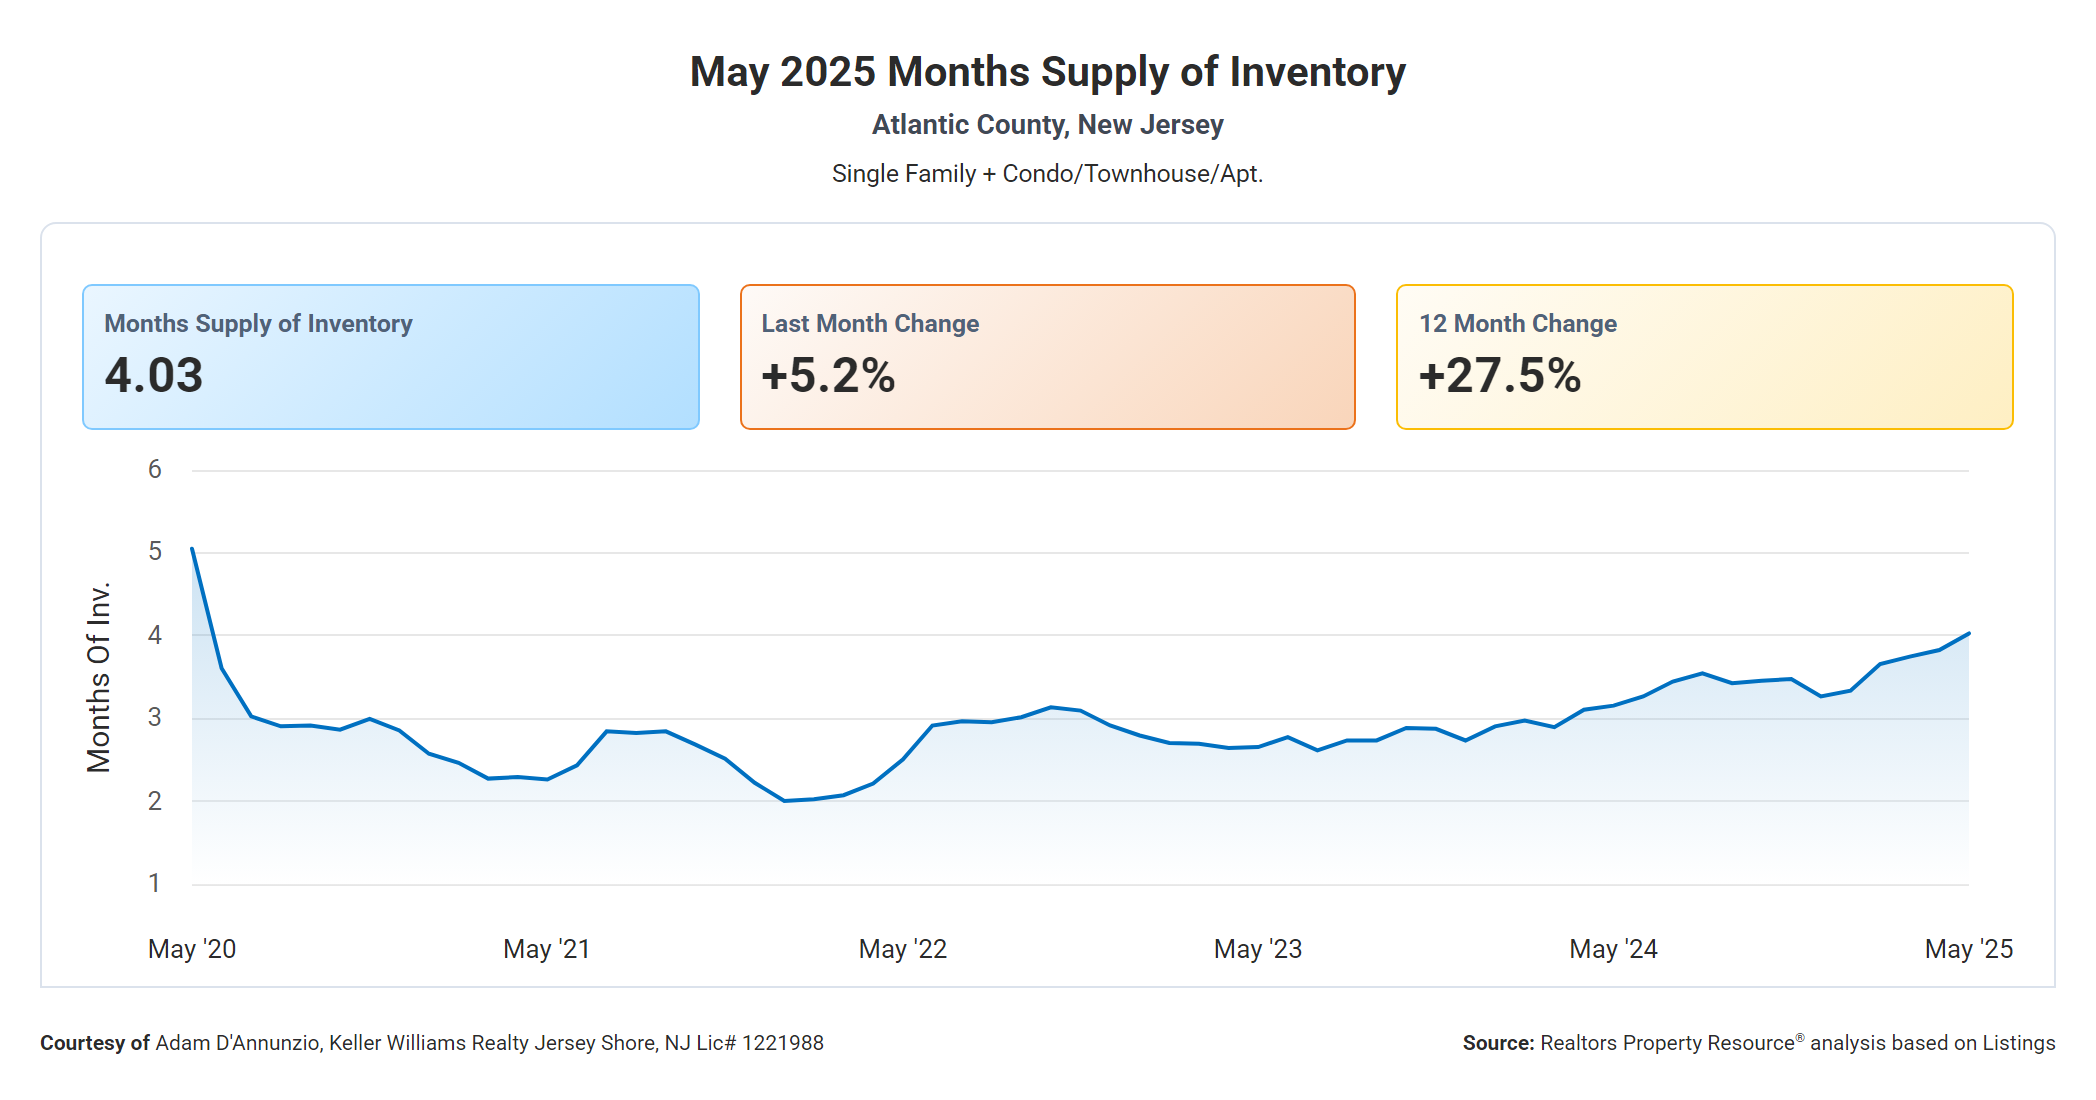
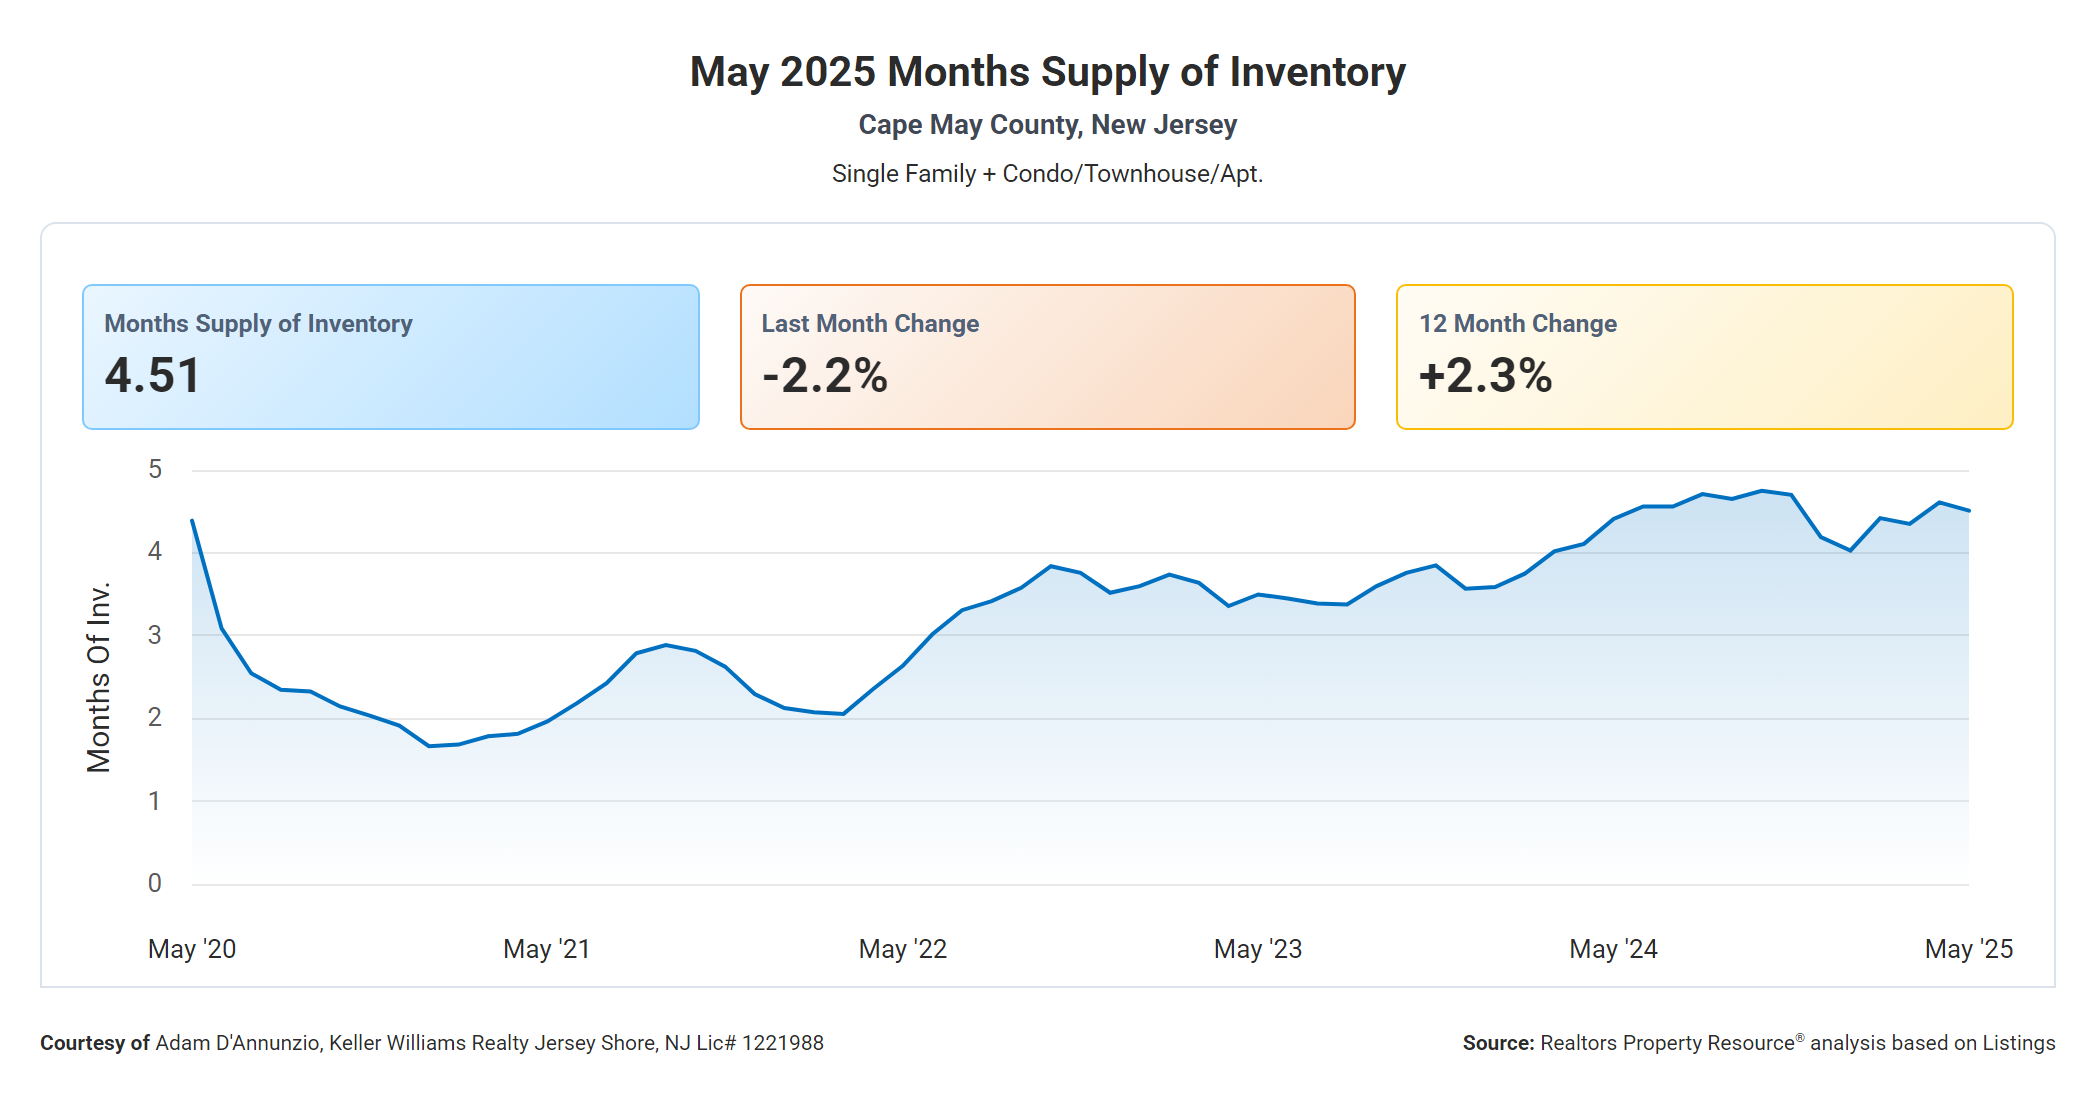
The South Jersey Shore market—covering Cape May and Atlantic Counties—remains healthier than many U.S. metros. Inventory is gradually rising, but homes are still selling close to asking price and within 30 days on average.
Cape May County:
- Median Sold Price: $700,000
- Inventory: 4.51 Months
- Days on Market: 26
- Sold-to-List Ratio: 97%
Atlantic County:
- Median Sold Price: $375,000
- Inventory: 4.03 Months
- Days on Market: 28
- Sold-to-List Ratio: 98.1%
National vs. Local Market Comparison
| Metric | National | South Jersey Shore |
|---|---|---|
| Inventory Change YoY | Up 31.5% | Slight increase, still under 6 months |
| Active Listings Trend | Above 1 million for first time since 2019 | Moderate growth |
| Price Growth | Flat or declining in some regions | Up 7–9% month-over-month |
| Expired Listings | Up 17.6% YoY | Low due to steady demand |
| Buyer Leverage | Increasing | Still mixed—strong demand persists |
New Jersey Mansion Tax Changes Proposed
New Jersey currently imposes a 1% mansion tax on homes sold over $1 million. Under Governor Murphy’s 2026 budget, that could increase significantly:
- 2% for sales between $1 million and $2 million
- 3% for sales above $2 million
This proposed change could significantly affect markets like Cape May, Avalon, and Stone Harbor, where high-end homes frequently sell above $1 million. Buyers and sellers in these price points should be prepared for potential tax impacts.
South Jersey Shore Town-by-Town Market Highlights
Cape May
- Median Sold Price: $937,500
- Inventory: 3.79 months
- Days on Market: 37
- Sold-to-List Ratio: 96%
The Wildwoods
- Median Sold Price: $589,900
- Inventory: 4.41 months
- Days on Market: 22
- Sold-to-List Ratio: 98%
Stone Harbor
- Median Sold Price: $2,650,000
- Inventory: 6.42 months
- Days on Market: 48
- Sold-to-List Ratio: 92%
Avalon
- Median Sold Price: $2,600,000
- Inventory: 7.4 months
- Days on Market: 43
- Sold-to-List Ratio: 95%
Sea Isle City
- Median Sold Price: $1,347,500
- Inventory: 2.88 months
- Days on Market: 32
- Sold-to-List Ratio: 96%
Ocean City
- Median Sold Price: $1,320,000
- Inventory: 4.61 months
- Days on Market: 23
- Sold-to-List Ratio: 97%
Longport
- Median Sold Price: $725,000
- Inventory: 5.56 months
- Days on Market: 33
- Sold-to-List Ratio: 98%
Margate
- Median Sold Price: $1,149,999
- Inventory: 5.66 months
- Days on Market: 47
- Sold-to-List Ratio: 95%
Ventnor
- Median Sold Price: $437,500
- Inventory: 4.49 months
- Days on Market: 20
- Sold-to-List Ratio: 97%
Brigantine
- Median Sold Price: $575,000
- Inventory: 5.24 months
- Days on Market: 28
- Sold-to-List Ratio: 97%
