The national housing story this spring is buyer leverage. More inventory, longer days on market, sellers cutting prices. That's the headline you're seeing on CNBC and in the Wall Street Journal.
The South Jersey Shore is telling a different story.
Locally, inventory is down year over year in both Cape May and Atlantic Counties, days on market dropped sharply through April, and both counties are still classified as seller's markets. If you've been reading national coverage and assuming our market looks the same, you're working off the wrong map.
Here's what the April 2026 data actually shows for our shore market, what it means against the national backdrop, and how sellers and buyers should be thinking about it.
The National Market in 60 Seconds
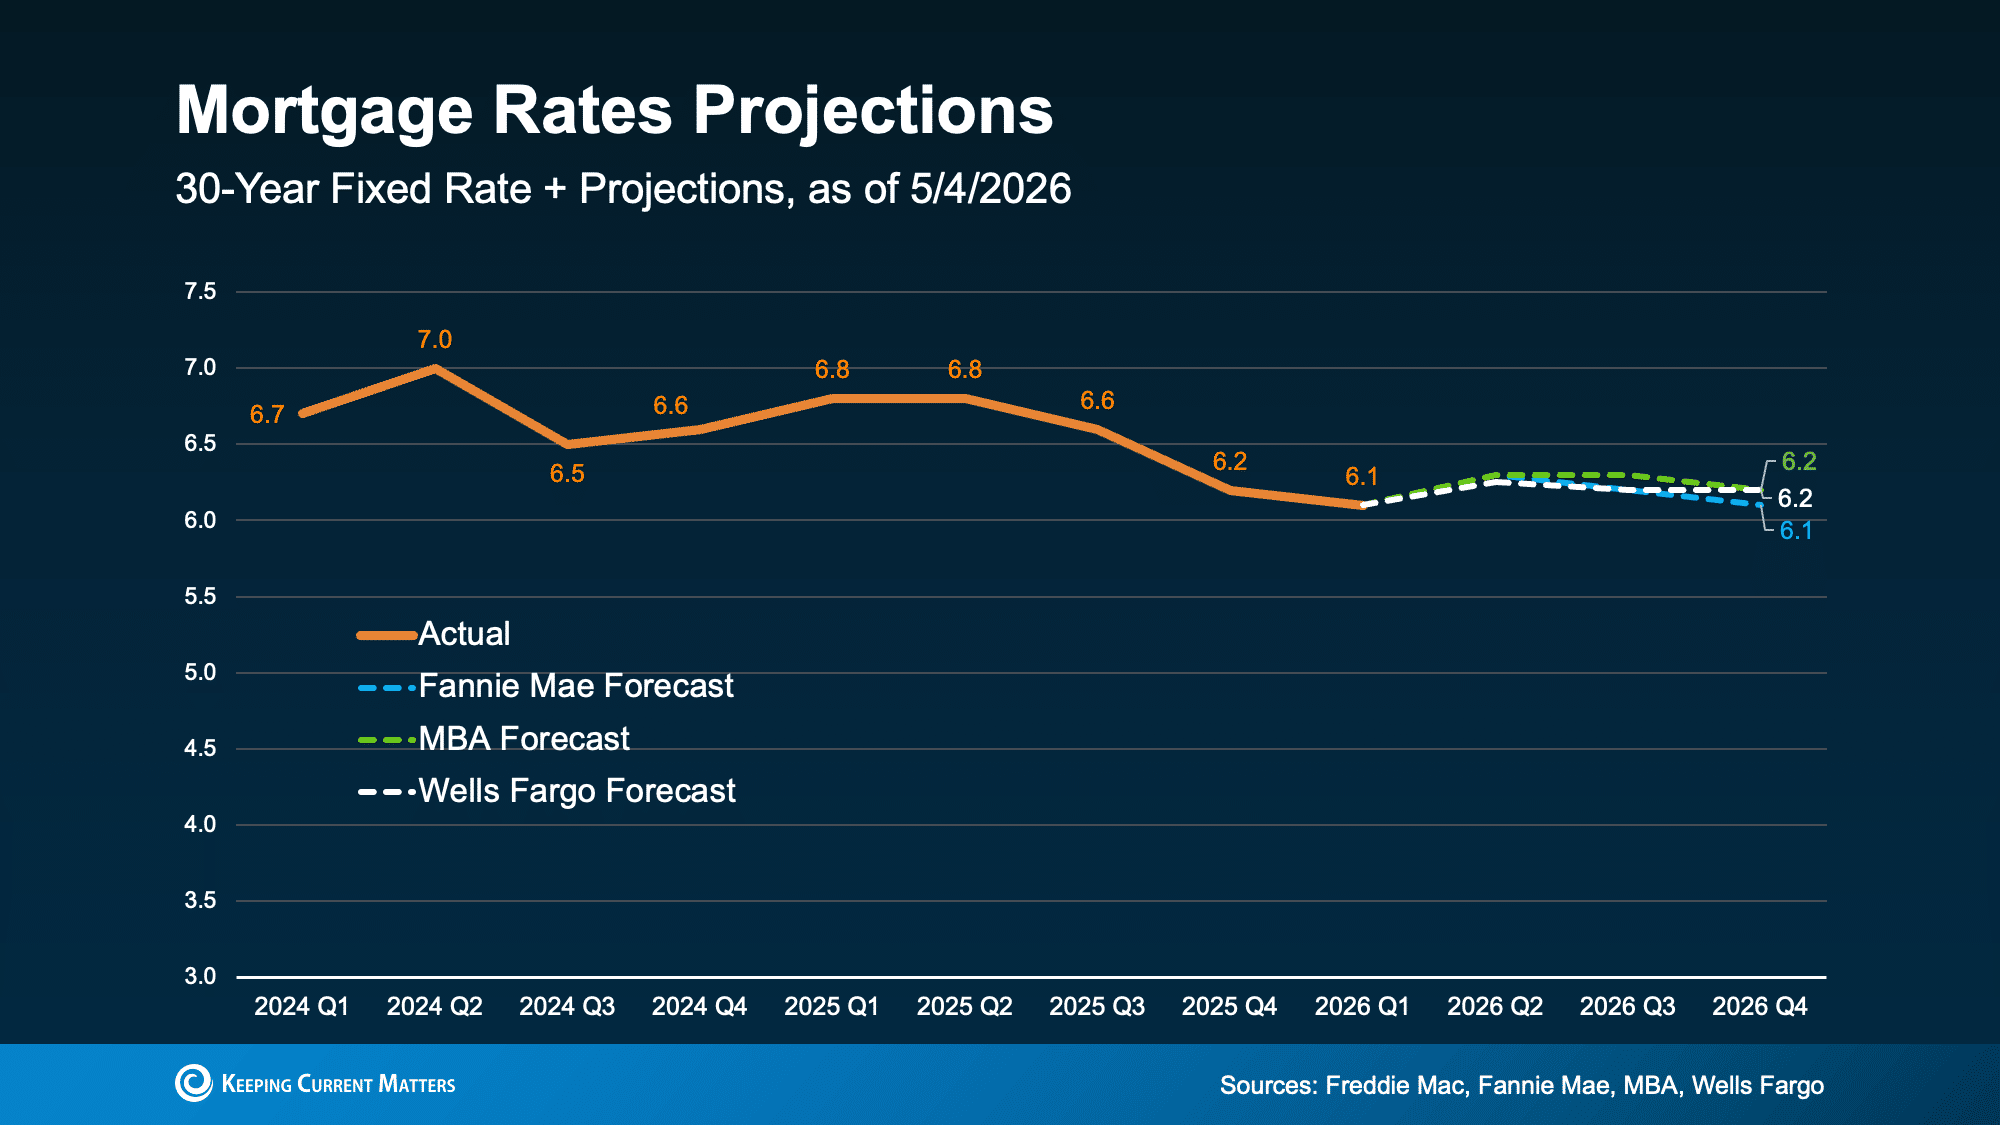
Mortgage rates spent April on a roller coaster. They spiked to a seven month high of 6.46% on April 2, then fell three straight weeks back below 6.30% as Iran ceasefire progress eased oil prices. As of early May, the average 30 year fixed sits around 6.44%.
Forecasts from Fannie Mae, MBA, and Wells Fargo all point to rates hovering in the low 6s through 2026, drifting toward the mid 6.1s by Q4. Anyone waiting for a 5 handle is going to be waiting a while.
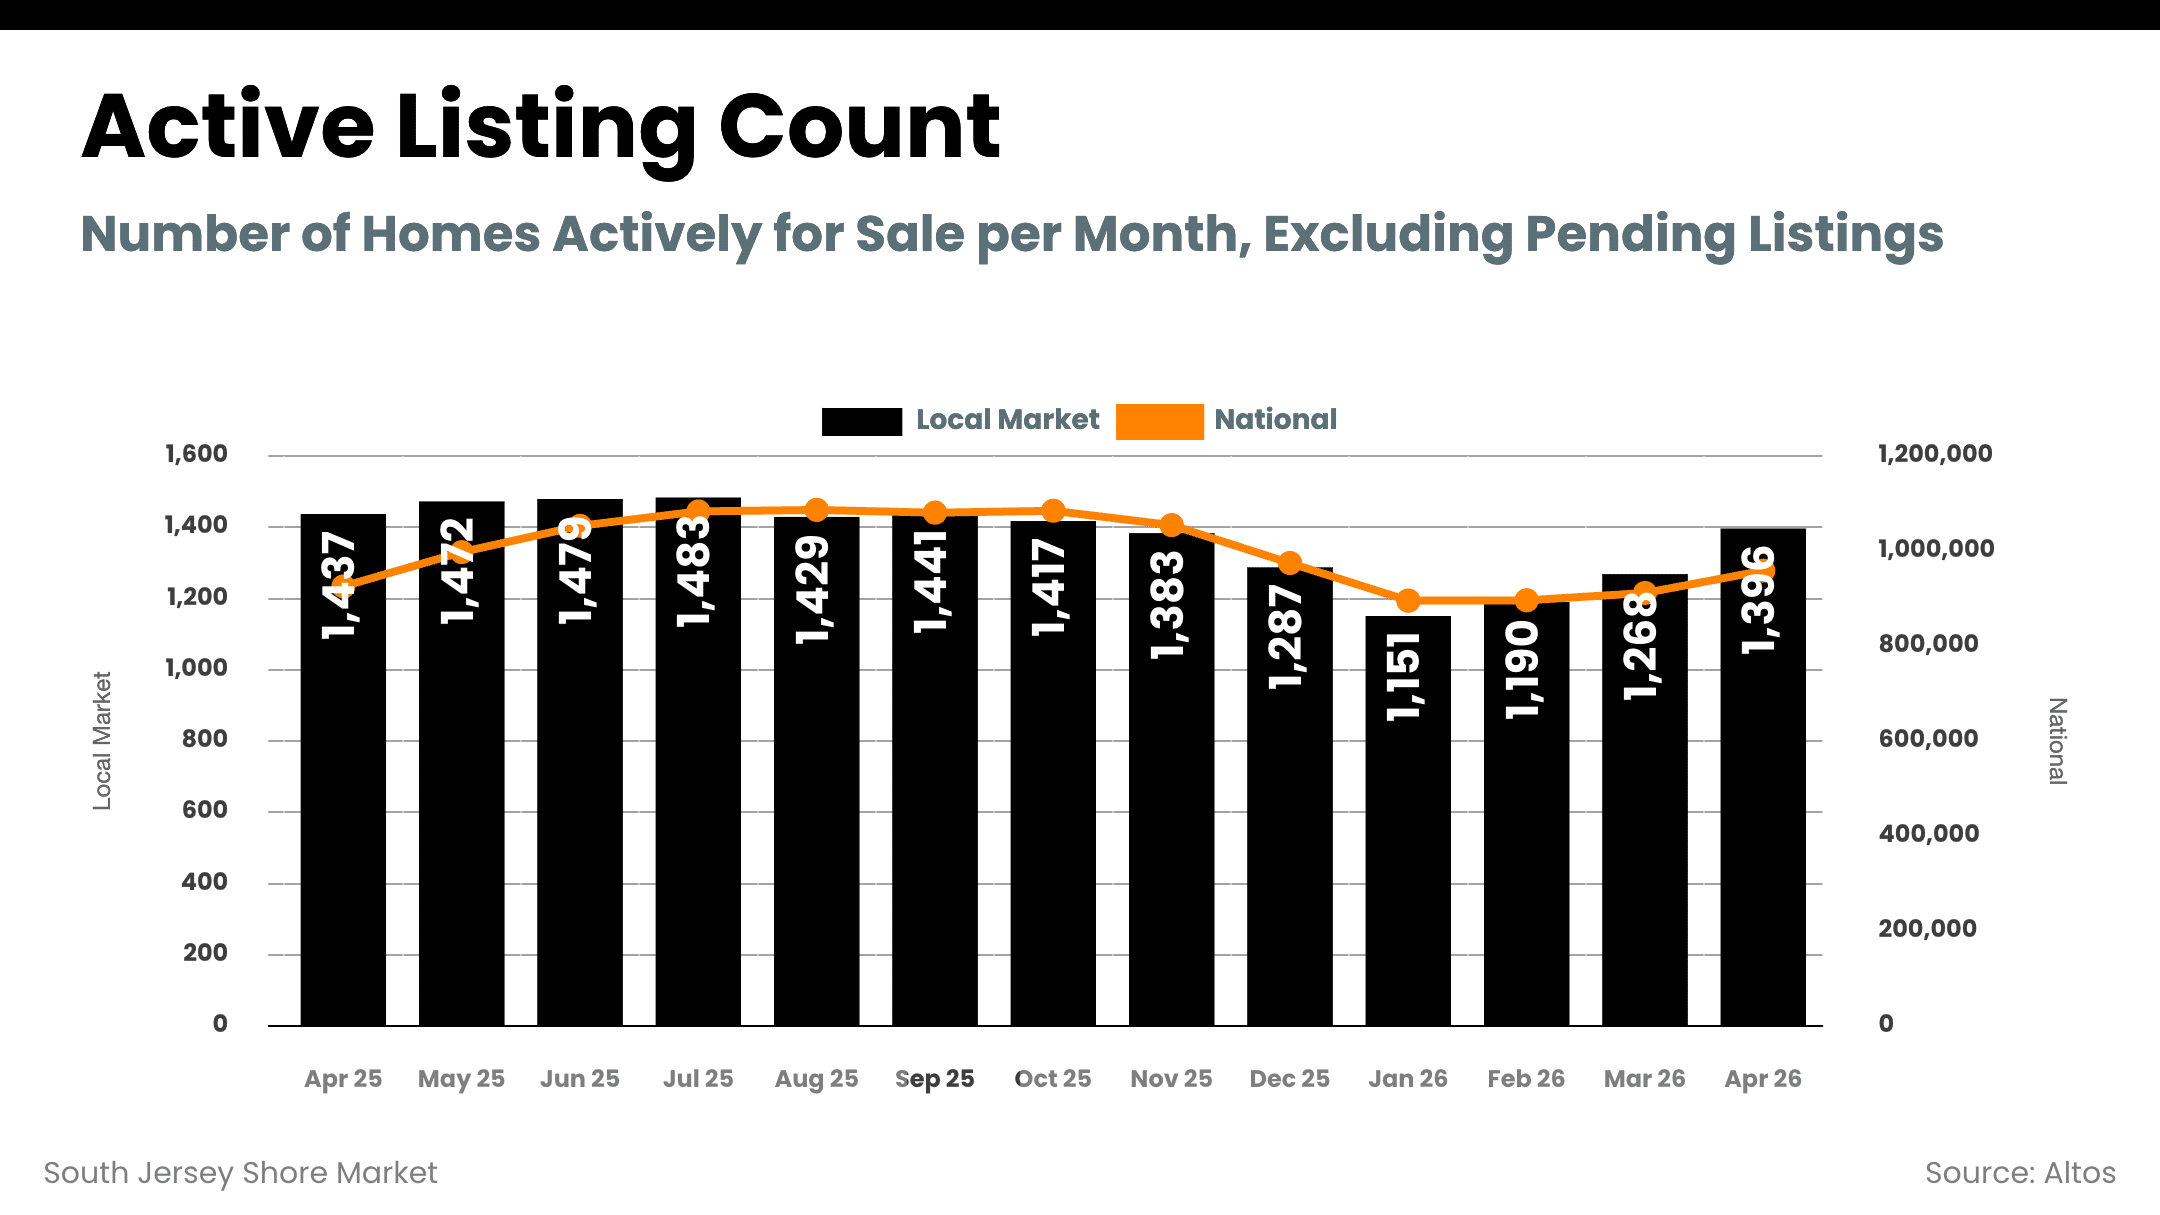
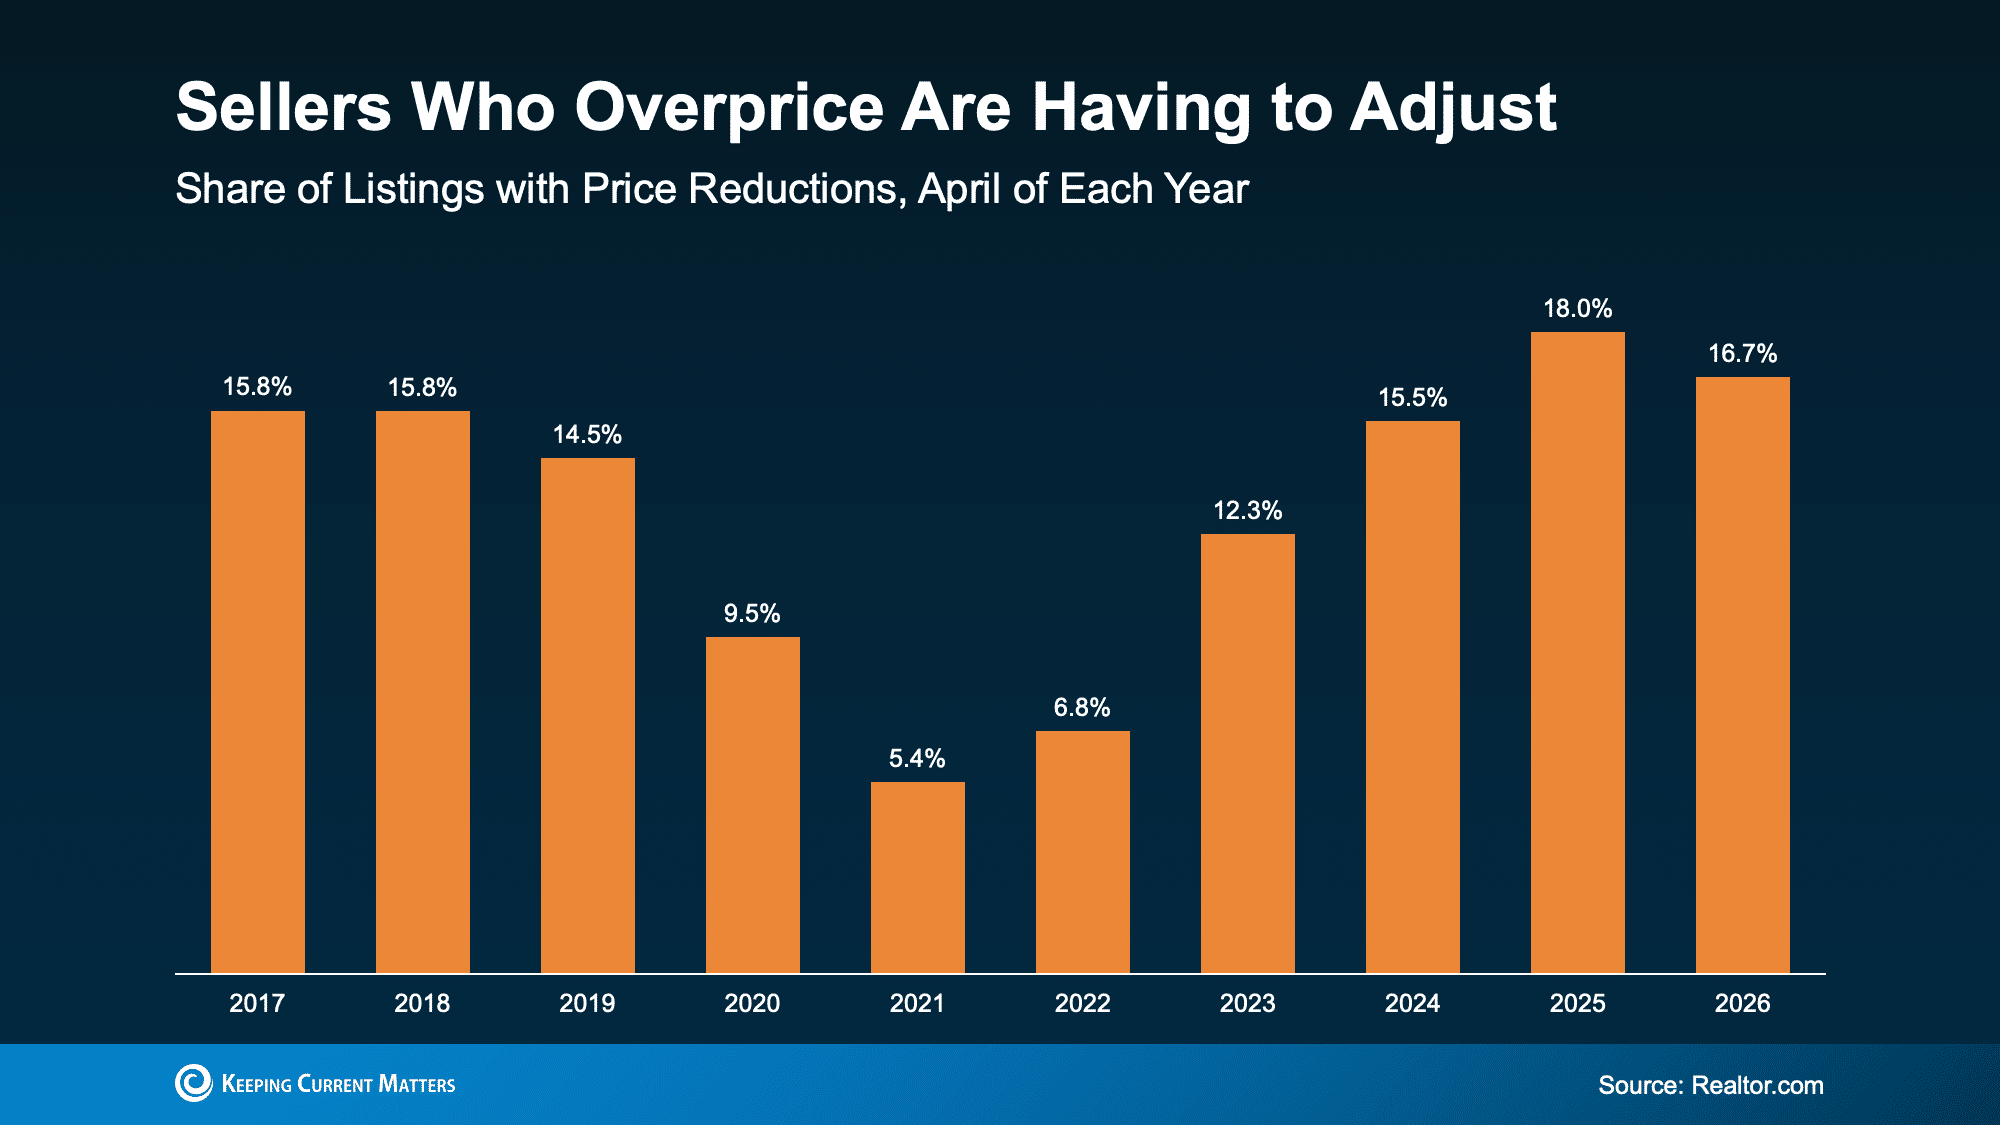
Nationally, active listings rose 4.6% year over year to just over 1 million homes. Median list price came in at $425,000, down 1.4% from last April. Time on market hit 52 days. And 16.7% of listings nationally saw a price cut, the second highest April reading since 2017.
Eleven of the 50 largest metros are now buyer's markets, up from eight a month ago. The leverage shift is real, but it's regional. The Sun Belt and Mountain West are softening fastest. The Northeast and Midwest are tightening.
We sit in the Northeast.
South Jersey Shore Market: The Local Numbers
Combining Atlantic and Cape May County data for April 2026:
- Active listings: 2,348 (Atlantic 1,349 + Cape May 999)
- Median sold price: Atlantic County $360,000 / Cape May County $622,500
- Sold to list price ratio: Atlantic 97.62% / Cape May 98.07%
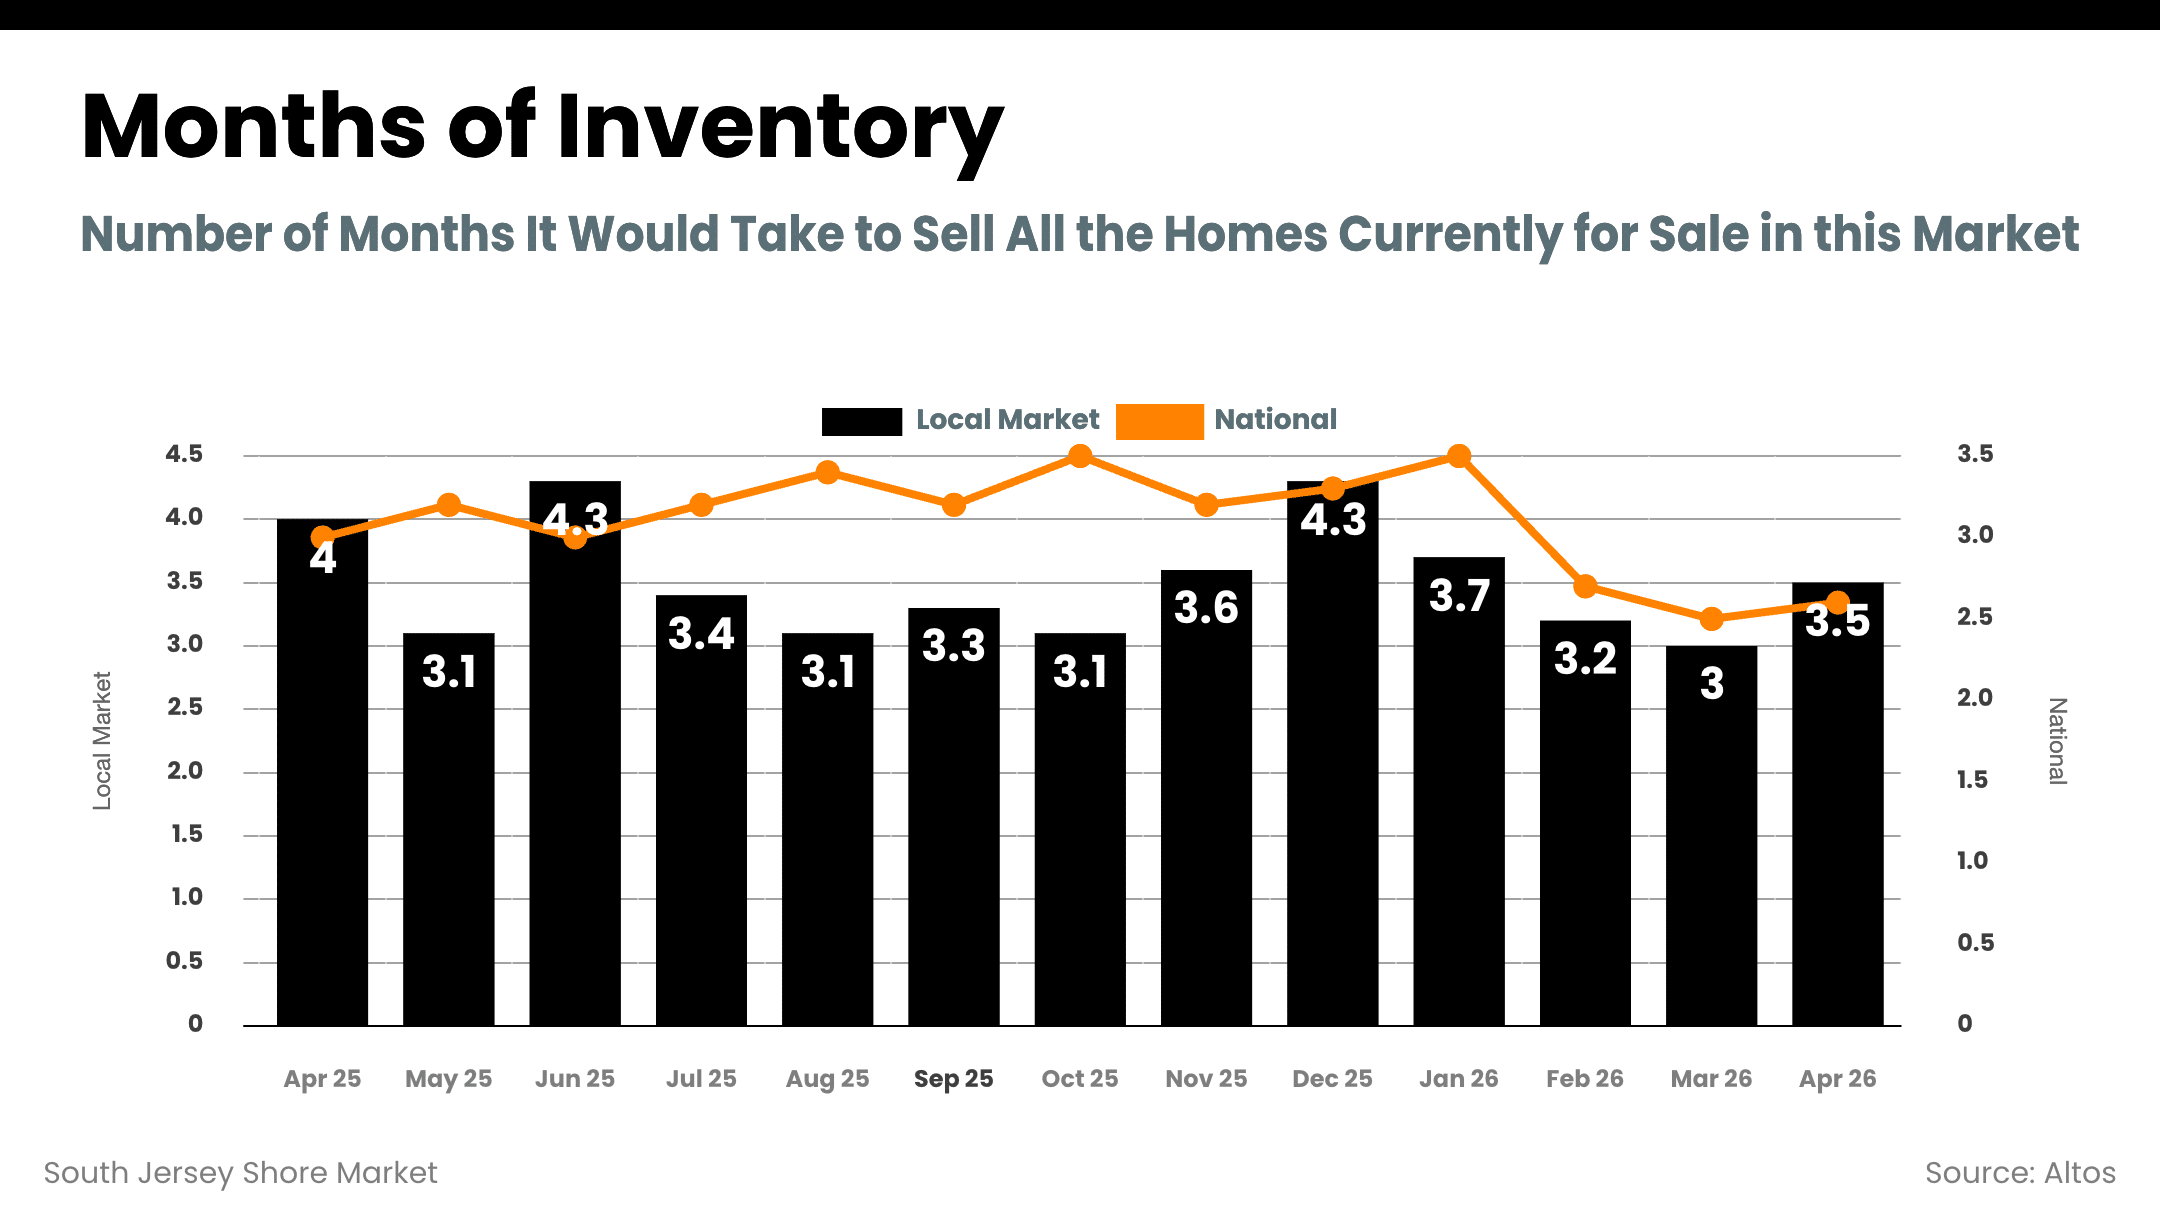
- Months of inventory: Atlantic 4.05 / Cape May 4.0
- Median days on market: Atlantic 29 / Cape May 32
Both counties classify as seller's markets, sitting right at the edge of balanced.
The inventory story is the one to pay attention to. Cape May County inventory is down 21.1% year over year. Atlantic County is down 8.8%. While the national narrative is more inventory and more buyer leverage, our local supply has gotten tighter, not looser.
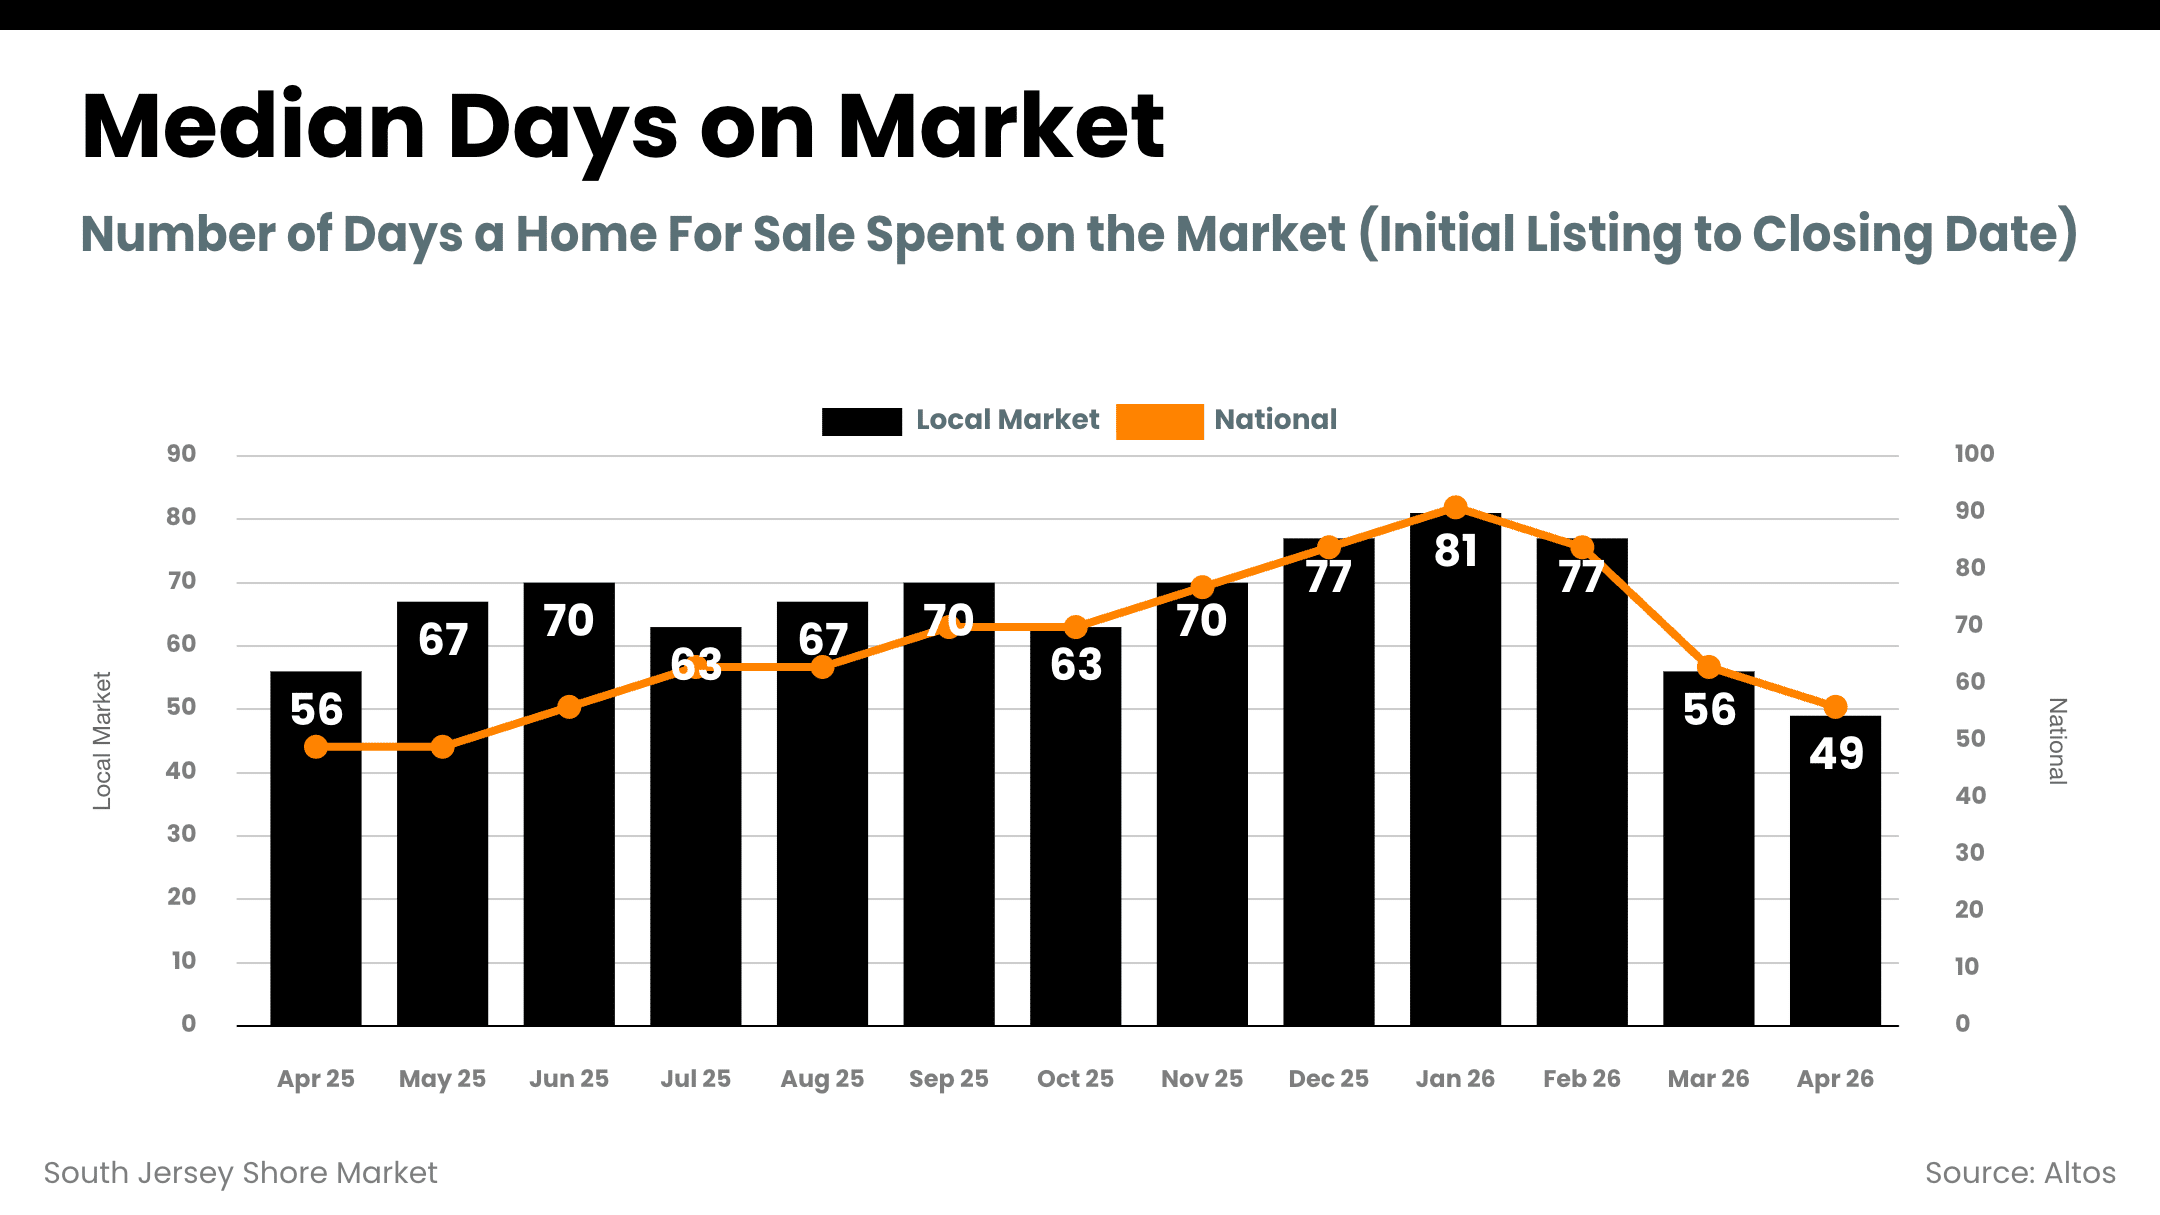
Days on market also tell a recovery story. Across the broader shore market, the typical home took 81 days to sell in January. By April that compressed to 49 days. Properly priced inventory is moving faster than it did over the winter, not slower.
What's Happening Town by Town
The county numbers smooth over a lot of variation. The town level data shows where the real action is.
Ocean City had the biggest sales month of any shore town with 64 closed transactions. Median sold price came in at $893,000 with a sold to list ratio of 97.6%. Median days on market: just 19. High volume, fast turnover, strong pricing.
Sea Isle City moved 17 properties at a $1.1 million median with a 98.2% sold to list ratio. Days on market sat at 46. Strong pricing power even on slower turnover.
Cape May City posted 26 sales at $597,500 median with a 98.3% sold to list ratio. 22 days on market.
Avalon is in its own category. Eight sales at a $2.83 million median, 42 days on market, 97.4% sold to list. Low volume is normal in the ultra luxury segment, but the pricing discipline is intact.
Margate showed an interesting split. Just 8 days on market for the homes that did sell, but the lowest sold to list ratio of the priority beach towns at 96.7%. Properties that were priced right moved fast. Others negotiated harder.
Ventnor moved 9 homes at $850,000 median with 34 days on market.
Wildwood Crest posted a $587,500 median with 16 days on market and 97.1% sold to list.
Somers Point is the outlier worth flagging. Median days on market: 116. Sold to list ratio: 94.8%. That's significantly slower and softer than the rest of the shore. If you own in Somers Point, the pricing strategy has to account for a market that's moving differently than the barrier islands two miles away.
The pattern across the beach towns is clear. The properties that priced correctly from day one are selling in two to four weeks. The ones that didn't are sitting.
The Pricing Story That Matters Most
Here's where national data and local reality intersect in a way every seller needs to understand.
A Realtor.com survey from April found that 80% of sellers expect to get their asking price or more. 37% expect more than asking. 46.4% expect to hit asking exactly.
The reality? 62% of homes nationally are selling below asking. And 16.7% of listings saw a price reduction in April, up from 5.4% in 2021 and 6.8% in 2022.
The gap between seller expectations and market reality is the widest it's been in years.
Locally, our sold to list price ratios show the same dynamic in milder form. Cape May County at 98.07% and Atlantic County at 97.62% means even in our tighter market, the average seller is leaving 2 to 3 percent on the table after final negotiation. On an $800,000 Avalon condo, that's $16,000 to $24,000.
The sellers getting full ask or above are the ones who priced correctly from day one.
Why Overpricing Costs You More Than You Think
Data from the National Association of Realtors quantifies what happens when a home sits:
- Sells in 0 to 14 days: average 4.9% price reduction
- 15 to 30 days: 6.1% reduction
- Over 120 days: 14% reduction
On a $400,000 home, the difference between selling fast versus sitting over 120 days is over $35,000 in your pocket.
In our market, sophisticated second home buyers track Zillow, Redfin, and Realtor.com daily. They see the price drops. They see the days on market counter ticking up. By the time you cut your price the second time, the buyer pool has already moved on.
The math is simple. The right price on day one beats a series of cuts every time.
What This Means If You're Thinking About Selling
Three things matter right now.
First, the market is still on your side locally. Both Cape May and Atlantic Counties are seller's markets with tighter inventory than a year ago. Days on market are dropping. Demand is showing up.
Second, that doesn't mean you can name your price. Buyers are sophisticated, they're well informed, and they're disciplined. The 80% of sellers who think they'll get asking or above are mostly going to be disappointed. Pricing this market correctly takes a real CMA, not a Zestimate.
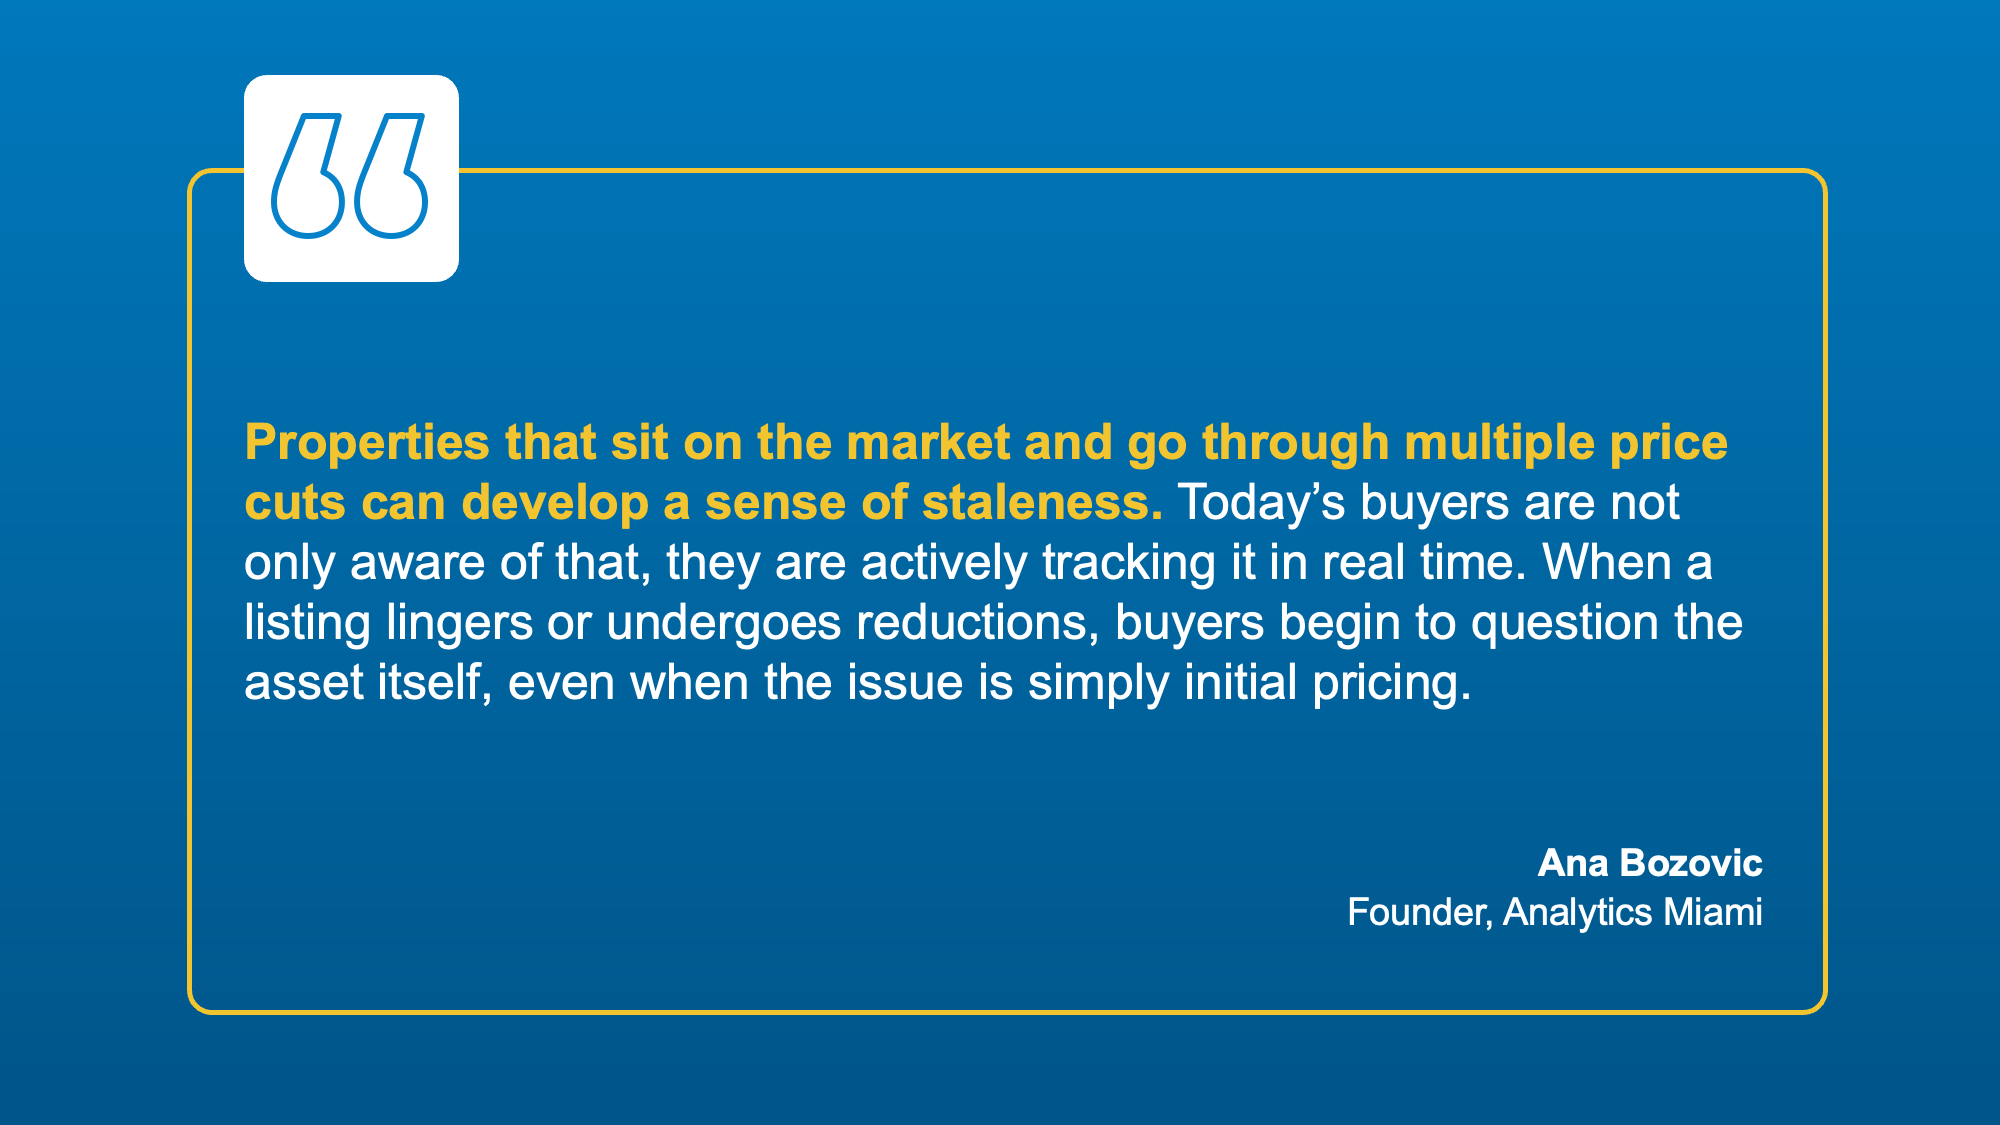
Third, the cost of getting it wrong has gone up. With days on market compressed for properly priced homes, an overpriced listing stands out faster. Staleness sets in quicker. Cuts come sooner.
If you're considering selling this season, the question isn't whether the market is good. The question is whether your price is right.
What This Means If You're Thinking About Buying
The national buyer leverage story isn't fully showing up here yet, but a few things still work in your favor.
Mortgage rates have come off the April peak and are projected to stay in the low 6s through the rest of 2026. If you've been waiting for a 5 handle, the major forecasters aren't predicting one. Locking in current rates versus waiting on a number that may never come is a real consideration.
Inventory at the shore is tight but not invisible. There are 2,348 active listings across Atlantic and Cape May Counties as of April. That's plenty of selection in most price points and most towns.
Sold to list ratios under 98% mean there's room to negotiate, especially on listings that have been sitting. A property at day 60 with one price cut already is a different conversation than a fresh listing at day 7.
The buyers winning right now are the ones who are pre approved, decisive, and working with someone who tracks new inventory in real time. The ones losing are the ones waiting for prices to crash in a market that doesn't have the inventory pressure to make that happen.
The Bottom Line
The South Jersey Shore is not the national market. Our inventory has tightened, days on market are compressing, and both counties remain seller's markets even as the national narrative shifts toward buyers.
But sellers shouldn't confuse a tighter local market with permission to overprice. The pricing discipline story is national, and our local sold to list ratios show buyers are negotiating here too.
For sellers, price right or be ready to adjust.
For buyers, rates are stable in the low 6s, inventory is workable, and the right property at the right price is moving fast.
If you want to talk through what any of this means for your specific situation, whether you own a property along the shore or you're shopping for one, reach out. The data tells the macro story. Your specific town, street, and property type tells the one that actually matters to your bottom line.
Local Area Specific Market Reports (these reports are updated every 48 hours)
Adam D'Annunzio is a top 1% real estate agent with Keller Williams Realty Jersey Shore, specializing in waterfront and vacation properties across Ocean City, Avalon, Sea Isle City, Cape May, Margate, Stone Harbor, Wildwood Crest, and Somers Point.