
The national headline this summer is buyer leverage. Asking prices are down year over year, homes are piling up in a lot of markets, and sellers are pulling listings off the market at the fastest pace since 2020. If you only read national coverage, you'd think the whole country is softening at once.
The South Jersey Shore isn't reading from that script. Not most of it, anyway.
Across the barrier-island resort towns, supply tightened over the past year, homes are selling faster than they were last June, and the disciplined markets are still closing in the high 90s as a percentage of list price. But it's not one uniform story. A handful of towns actually loosened, and the Atlantic County mainland looks different from the Cape May County islands. That split is the whole point of this month's update.
Here's what the June numbers say, what's driving them, and what it means whether you're thinking about buying or selling a shore house this year.
The June numbers at a glance:
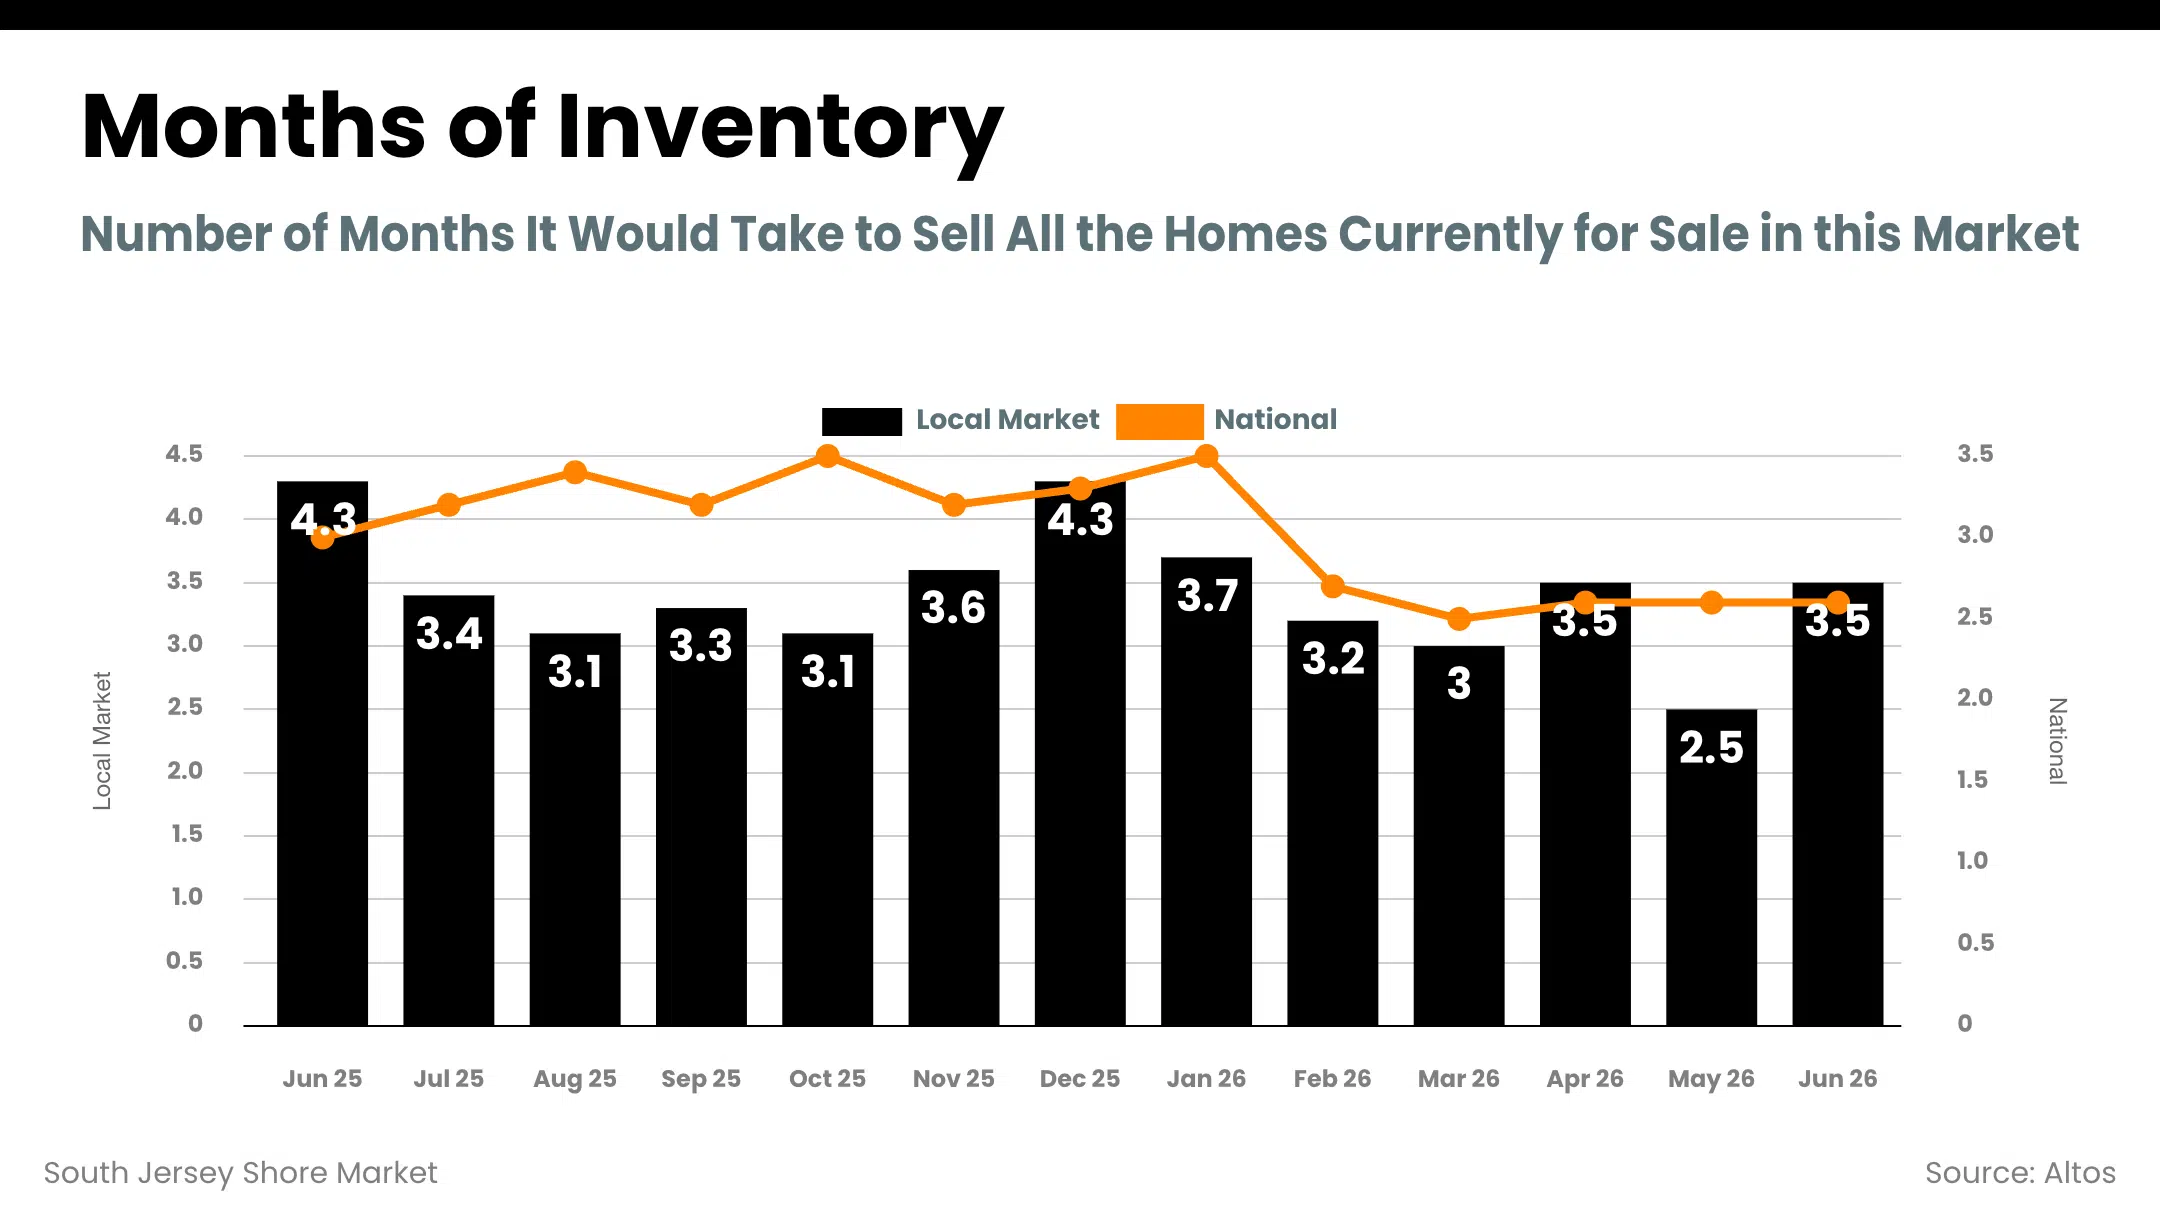
Shore months of supply fell from 4.3 to 3.5 year over year.
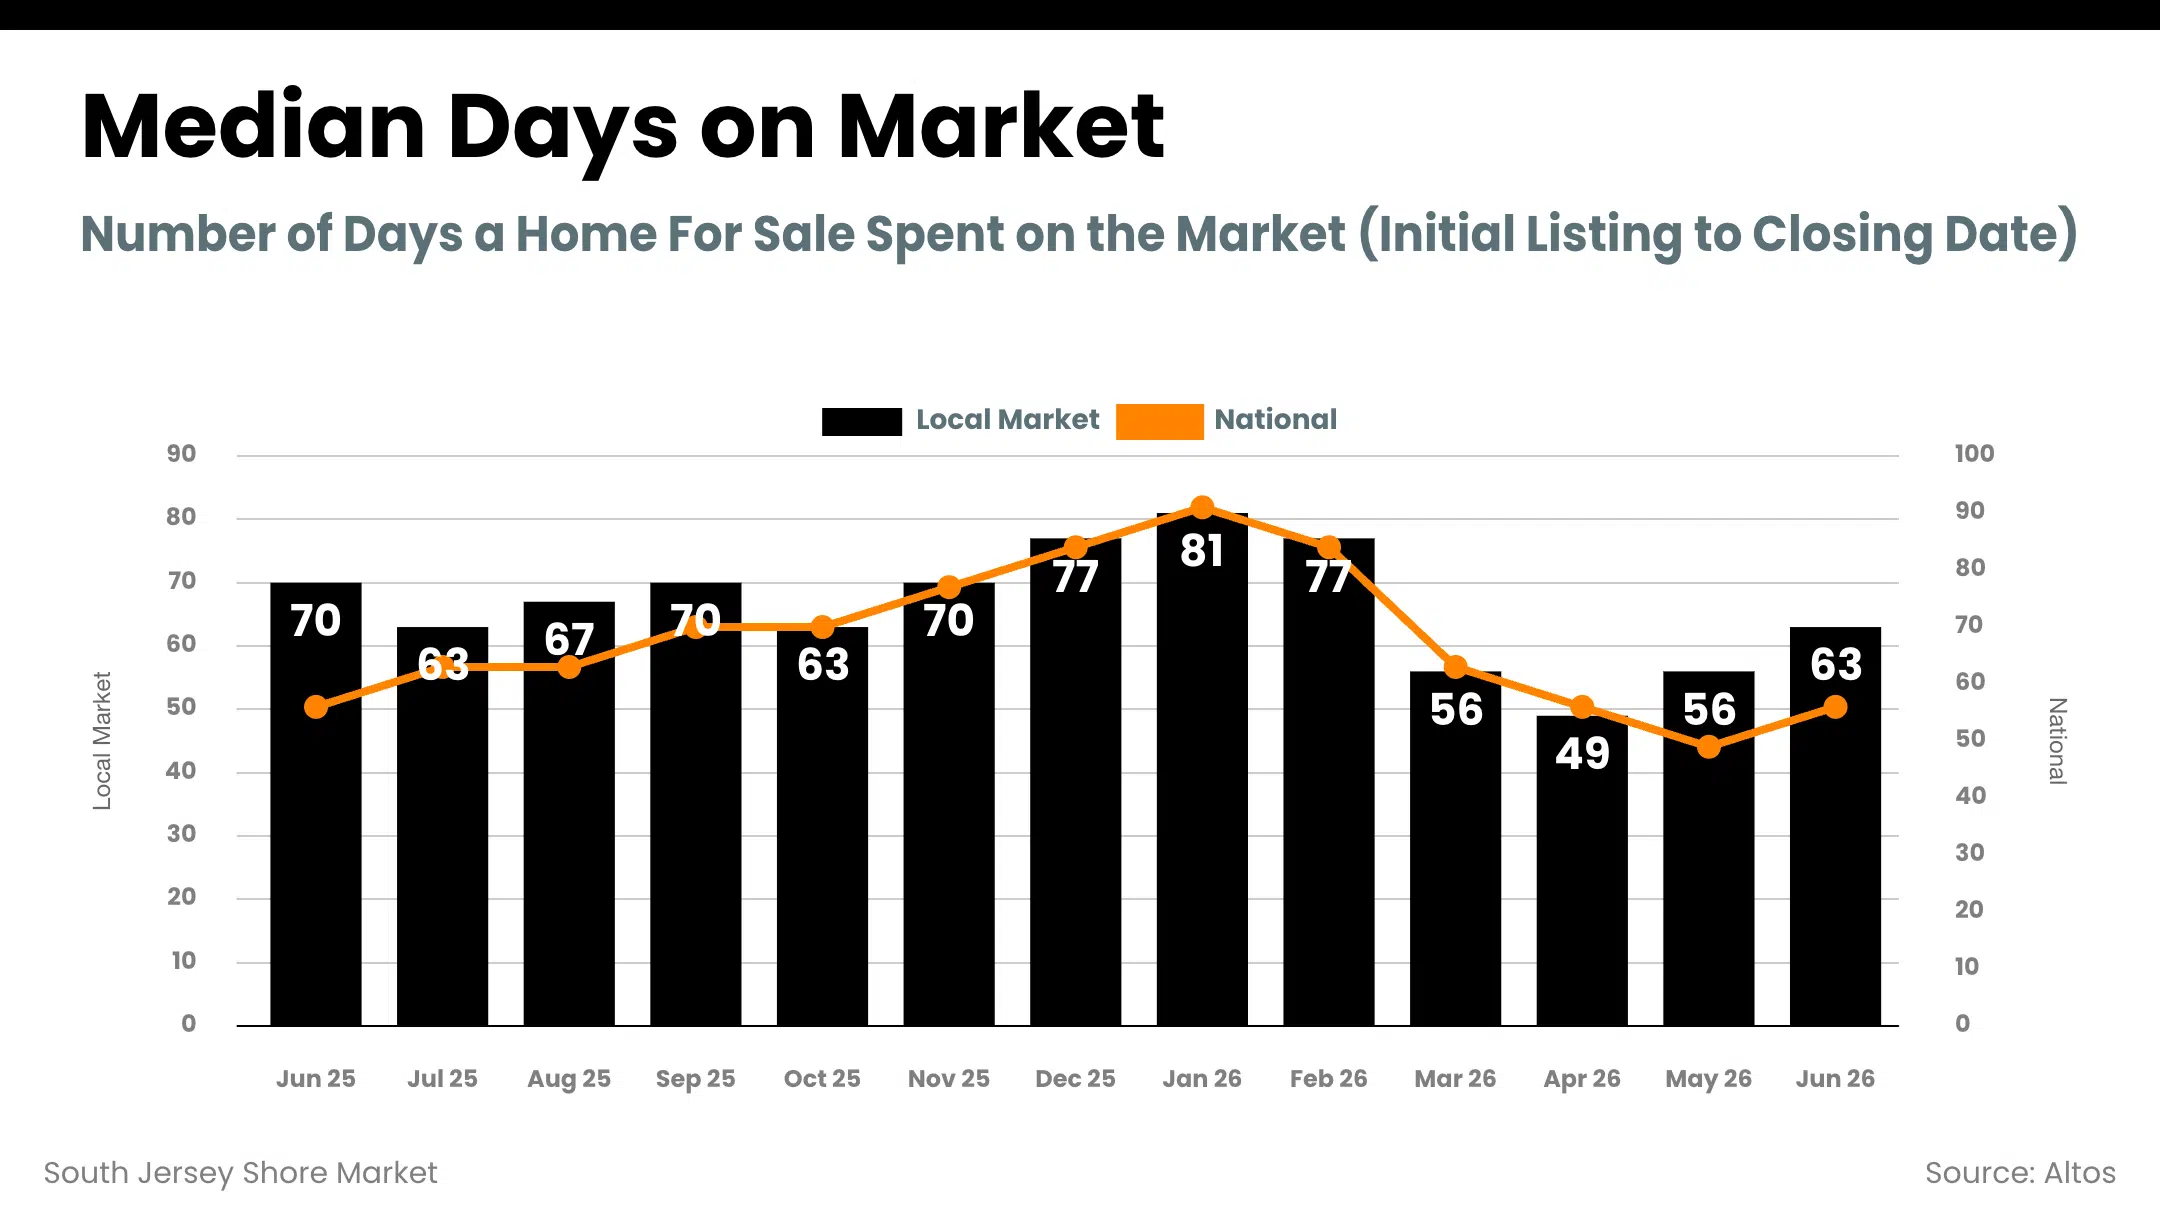
Homes sold in a median of 63 days, down from 70 a year ago.
Prices held firm. The disciplined towns are still closing in the high 90s as a share of list price.
What's Happening in the National Housing Market Right Now?
Nationally, the market has tilted toward buyers all year. Asking prices are down 2.3% from a year ago. The number of homes for sale is above 1.1 million and running about 1.8% higher than last summer. And for the first time since April 2024, homes across the country are selling a hair faster year over year, a small sign that the slow grind of the past two years may be stabilizing.
The bigger tell is on the seller side. In April, 5.8% of all U.S. listings were pulled off the market without selling, tied for the highest share since the pandemic froze everything in March 2020. Sellers are looking at the competition, not getting the number they wanted, and deciding to wait rather than cut. That's happening from Atlanta to Pittsburgh.
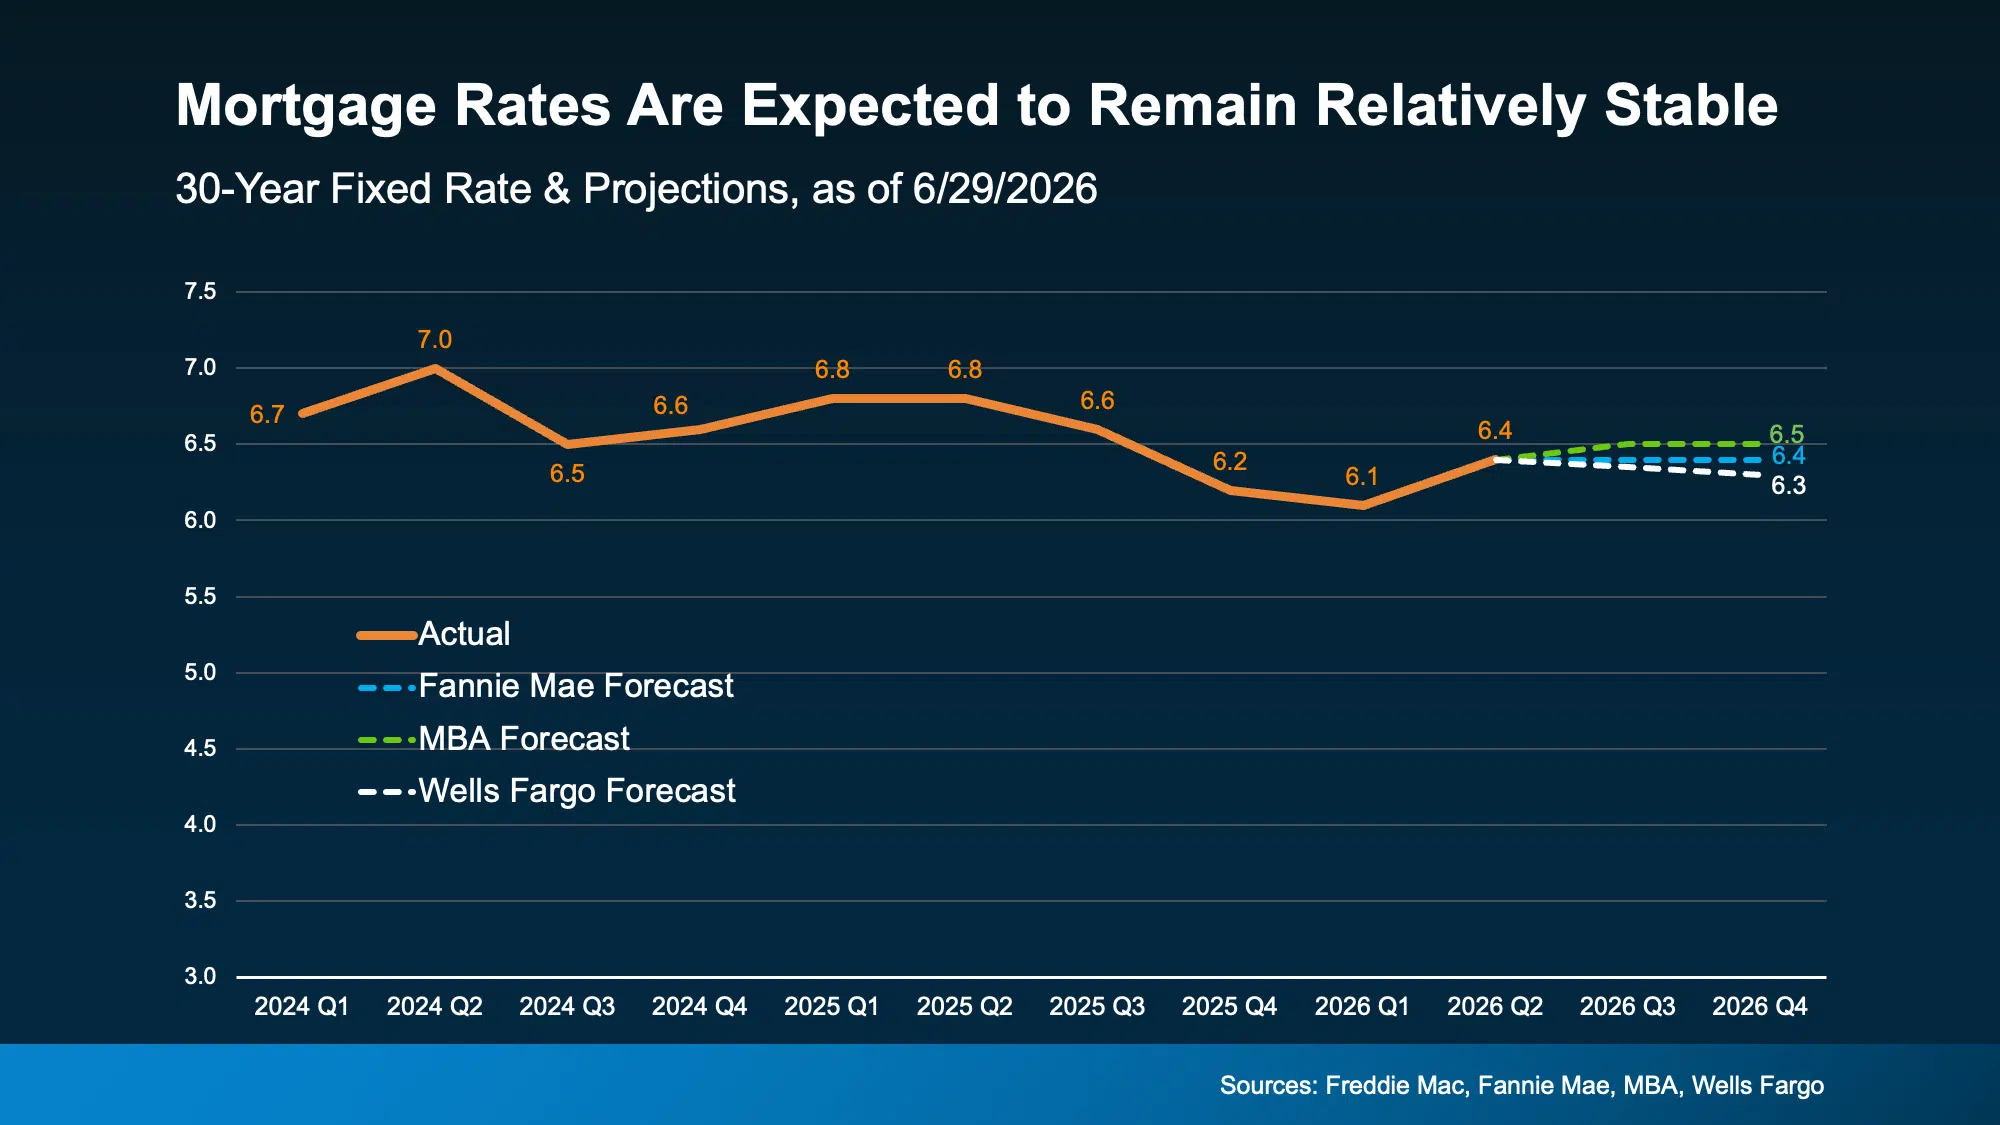
Mortgage rates are the reason the market hasn't broken loose in either direction. The 30-year fixed sits at 6.49%, up six basis points last week as the ceasefire with Iran started to wobble and oil prices climbed again. Rates had been inching toward a retreat. That's on hold for now.
The forecasts are boring, and boring is good for planning. The consensus has rates parked in the low-to-mid 6s through the end of the year and into 2027. Nobody credible is calling for a big drop, and nobody's calling for a spike either.
On prices, the national outlook still points up, just gently. The blended forecast for 2026 is about 2.3% growth, with the range running from 4% on the high end to under 1% on the low end. Slower than inflation, which means homes are getting slightly cheaper in real terms even as the sticker price rises. That's the affordability thaw everyone's been waiting on, and it's finally showing up.
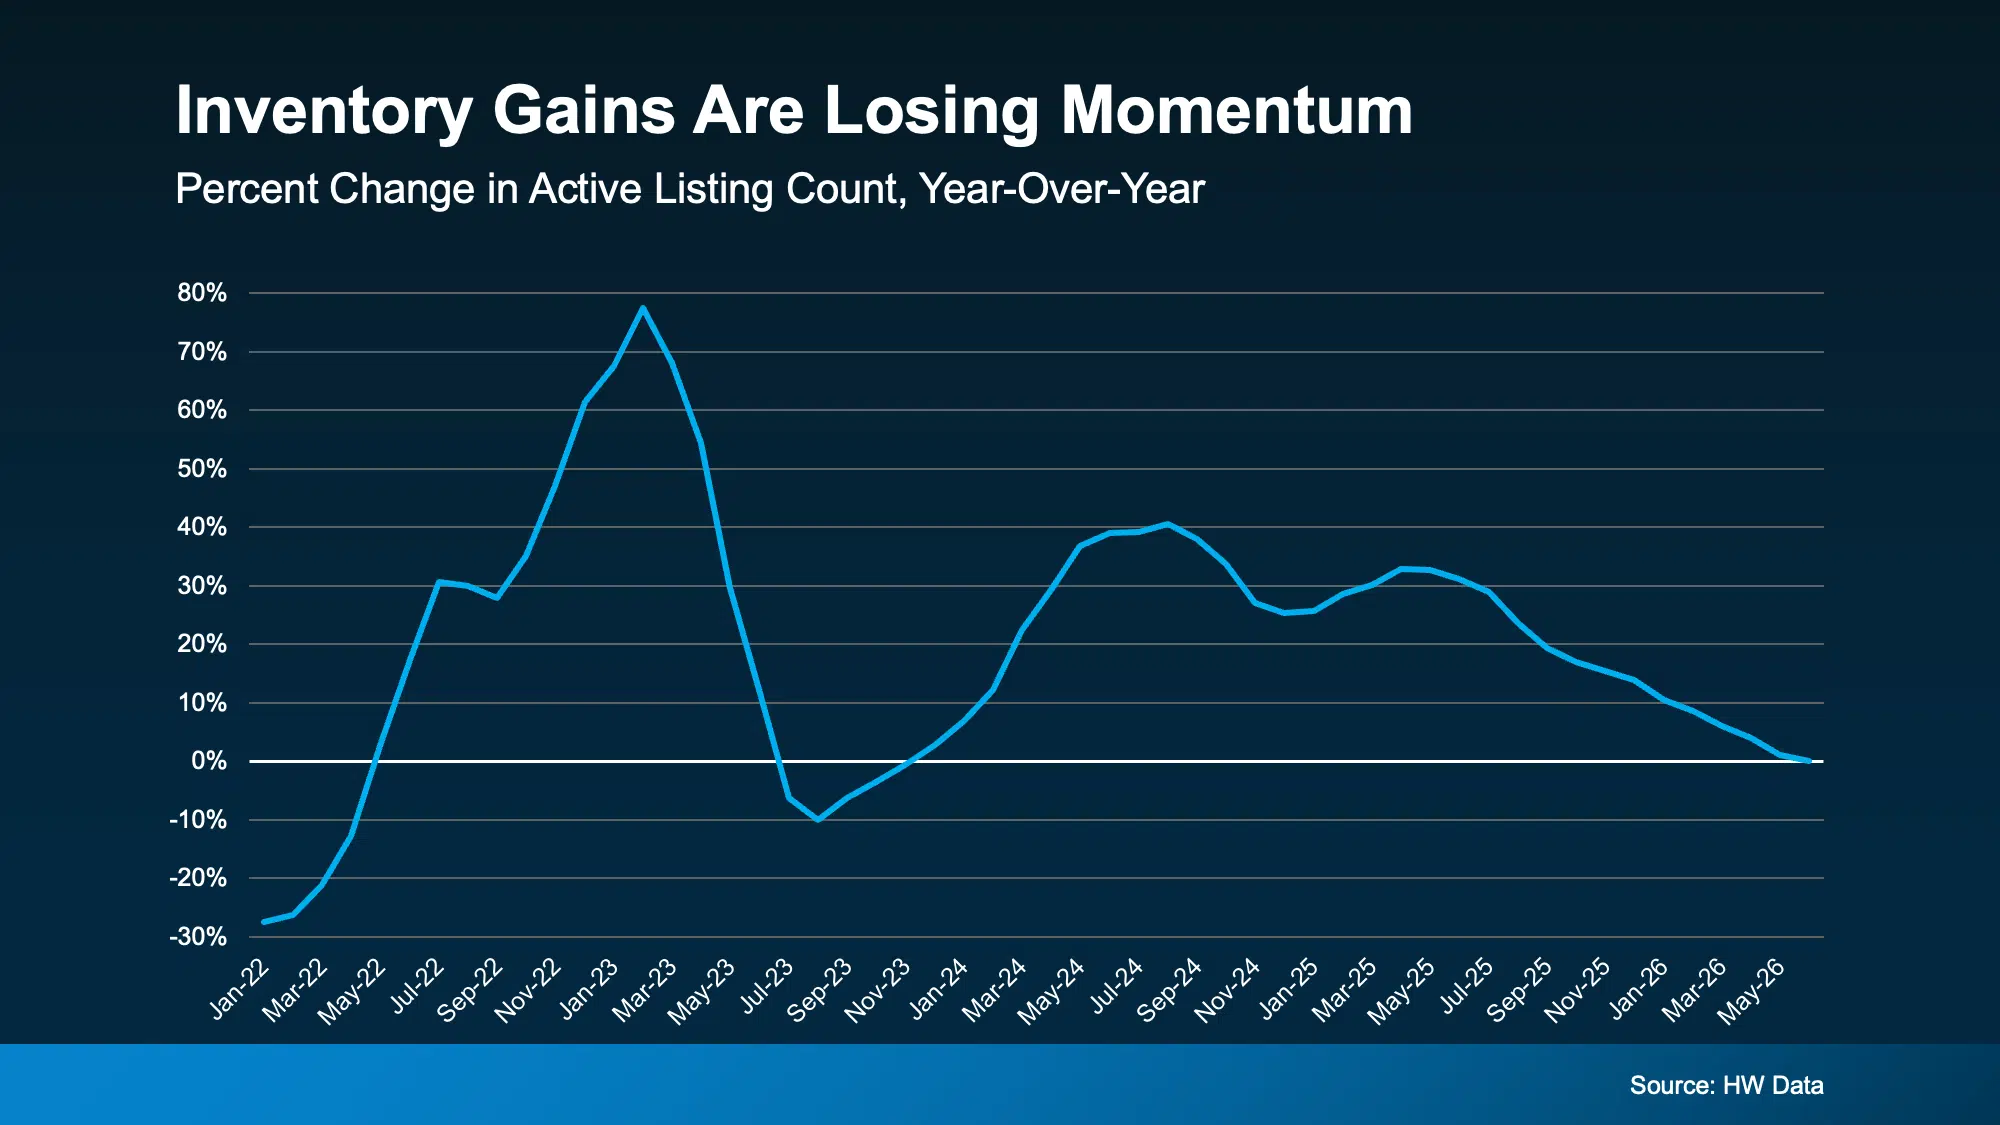
One more thing worth flagging, because it sets up the local pivot. That national inventory build has run for four straight years, and it just flattened out. The Northeast is where the shortage is still most acute, and it was the only region in the country to post a monthly gain in existing-home sales in June. We sit in the Northeast. That matters.
How Is the South Jersey Shore Housing Market Doing?
Start with the two counties, because they tell different stories. In Cape May County, the median sold price in June was $730,000, homes closed at nearly 97% of list, and months of supply sat at 3.96. That supply reading is down 22.5% from a year ago. Cape May County has genuinely tightened.
Atlantic County is steadier. Median sold price was $414,100, sold-to-list ran at 97.9%, and months of supply held at 4.43, essentially flat year over year. Both counties are balanced markets on paper. The difference is direction. One is compressing, one is holding.
Zoom out to the shore as a whole and the tightening shows up clearest in two places. Months of inventory across the combined market fell from 4.3 last June to 3.5 this June. And the pace picked up. Median days on market dropped from 70 to 63 over the same stretch. Read that again. Homes on the shore are moving faster than they were a year ago, at a moment when the national conversation is all about slowdown.
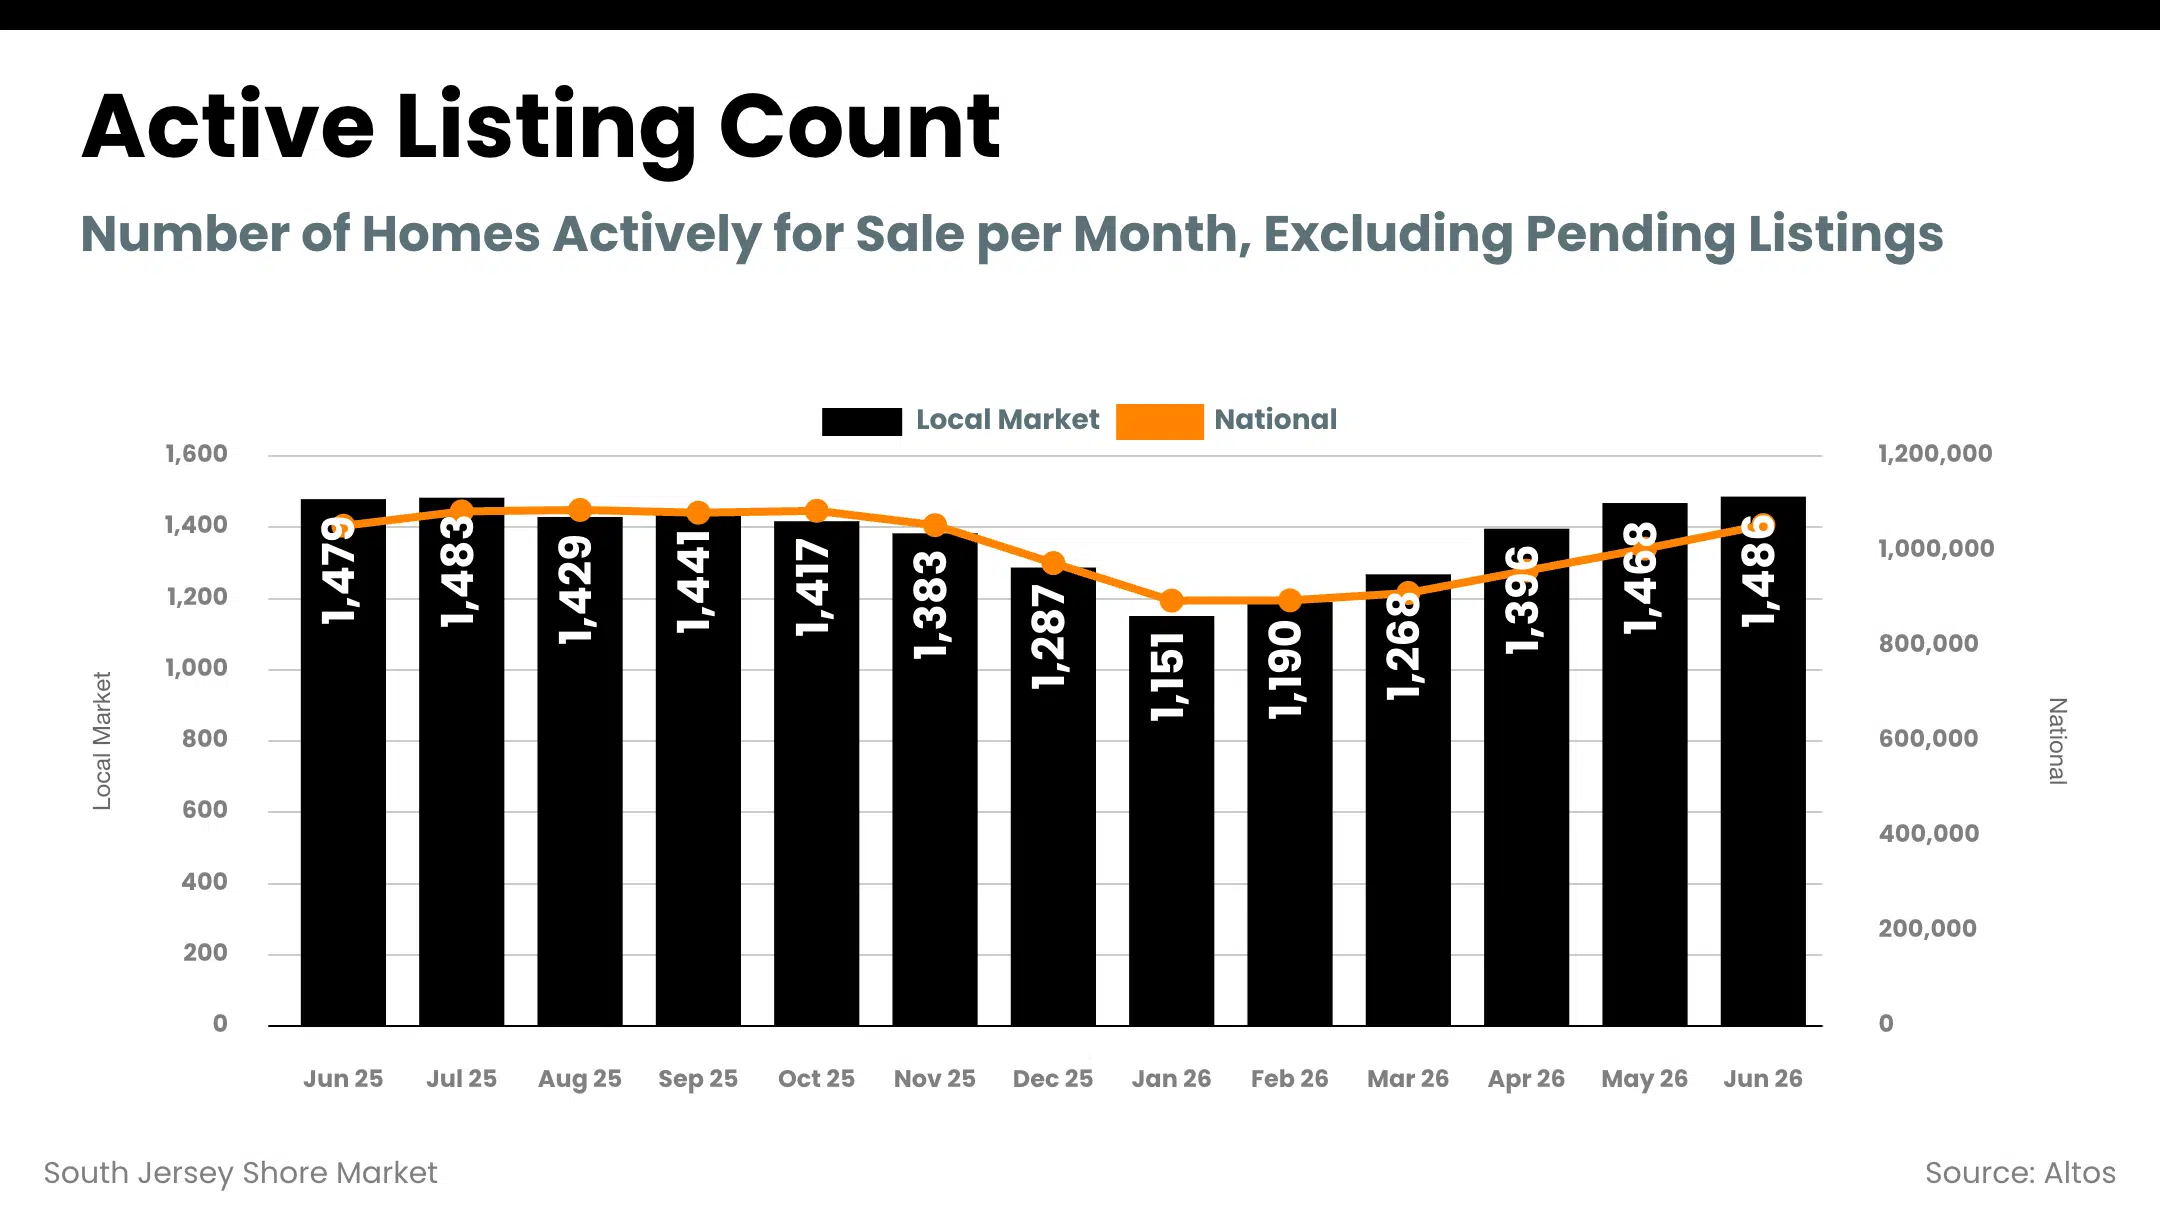
Active listings tell the counterweight. Shore-wide inventory is basically flat year over year, sitting near 1,486 active homes versus 1,479 last June. So this isn't a supply crunch driven by a listing drought. It's demand holding firm against a steady supply, and buyers absorbing what comes to market a little quicker than they did in 2025.
Which Shore Towns Are the Hottest Right Now?
This is where the single-story narrative falls apart, and it's the honest version of the market.
Sea Isle City is the tightest priority market on the shore. Months of supply came in at 2.64, down more than 35% year over year, with a median sold price of $1,372,500. When supply gets that thin in a town at that price point, sellers hold the cards.
Cape May City posted the single biggest supply compression of any town we track. Months of inventory fell 42% year over year to 2.74. Median sold was $731,500, homes closed at 97.7% of list, and they went from list to contract in a median of 24 days. That's a fast, disciplined market.
Brigantine is quietly one of the strongest stories on the board. Supply down 35% year over year, sold-to-list at 98.9%, and a median of just 20 days on market. On 31 sales in June, that's a real sample, not a fluke.
Ocean City is doing what Ocean City always does: leading on volume. 63 sales in June, more than double any other town on the island, at a $1,045,000 median. Months of supply is 4.69, down 13.5% from last year. At that price point and that transaction count, OC is running as efficiently as any resort market on the East Coast.
Then the other side of the split. Ventnor saw months of supply expand about 12% year over year to 5.82. Somers Point loosened roughly 8% to an even 4.0 months, though it's still closing at a sharp 98.5% of list. Wildwood Crest ticked up about 8% on supply but remains fast, with a median of 15 days on market and 98.5% sold-to-list. These aren't weak markets. They just moved the opposite direction from the Cape May islands.
Avalon deserves a note for the luxury buyer. Median sold price was $3,275,000 in June, months of supply of 5.54 that's down 26.5% year over year, but homes there take longer to trade, a median of 58 days. High end, thinner volume, patient money. That's the Avalon pattern.
Elsewhere on the shore: Margate sits at 5.13 months, down 21% year over year, median $999,999. Linwood on the mainland is at 5.75 months with a $544,500 median. Wildwood City and North Wildwood both compressed, down about 20% and 17% respectively. On the Atlantic County mainland, Egg Harbor Township and Mays Landing both loosened, which fits the broader pattern of mainland softening while the islands hold.
A quick word of caution on the small towns. Cape May Point, Strathmere, Diamond Beach, and Longport all sold a handful of homes in June, single digits in most cases. When the sample is that thin, one unusual sale swings the median hard, so don't read a trend into those months. The same goes for Stone Harbor, where four sales in a month can't tell you much about direction.
The pattern underneath all of it: the Cape May County islands are the tight end of this market, the Atlantic County mainland is the loose end, and the barrier-island towns in between are mostly compressing.
Which South Jersey Shore Towns Have the Tightest Supply?
Here's every priority town ranked by months of supply, lowest to highest. Lower supply favors sellers. The year-over-year column shows which direction each market moved.
| Town | Months of Supply | YoY Change | Median Sold | Sold/List | Days on Market |
|---|---|---|---|---|---|
| Sea Isle City | 2.64 | -35.3% | $1,372,500 | 97.7% | 50 |
| Cape May City | 2.74 | -42.1% | $731,500 | 97.7% | 24 |
| Brigantine | 3.72 | -35.4% | $590,000 | 98.9% | 20 |
| Somers Point | 4.00 | +8.4% | $486,000 | 98.5% | 42 |
| Ocean City | 4.69 | -13.5% | $1,045,000 | 96.5% | 32 |
| Wildwood Crest | 4.93 | +7.9% | $443,750 | 98.5% | 15 |
| Margate | 5.13 | -21.1% | $999,999 | 95.2% | 44 |
| Avalon | 5.54 | -26.5% | $3,275,000 | 95.7% | 58 |
| Linwood | 5.75 | -9.2% | $544,500 | 97.0% | 16 |
| Ventnor | 5.82 | +12.4% | $820,000 | 95.8% | 16 |
June 2026 data, single family plus condo/townhouse. Months of supply is a pending-based reading. Blue = supply compressing year over year (tighter, favors sellers). Orange = supply expanding (looser, favors buyers).
Here's the same data as a picture. These are the year-over-year changes in months of supply for each priority town. Blue bars compressed, meaning tighter than last June. Orange bars loosened.
Year-over-year change in months of supply, June 2025 to June 2026. Bar length reflects the size of the change.
Are Home Prices Dropping at the Jersey Shore?
No, and this is where the national number and the local number pull apart. Nationally, asking prices are down 2.3% year over year. The median existing-home price still hit an all-time high of $440,600 in June, up about 2% from last year, but the softening in list prices is real.
On the shore, prices are holding. The clearest local read isn't the median, which bounces around with the mix of what sold. It's the sold-to-list ratio, the gap between what sellers ask and what they get. In the disciplined towns, that gap is tiny. Brigantine at 98.9%. Somers Point and Wildwood Crest at 98.5%. Sea Isle and Cape May City at 97.7%.
Put a dollar figure on it. On a $1,045,000 sale in Ocean City closing at 96.5% of list, that's roughly $36,000 between the asking price and the final number. On a tighter town, the spread is smaller. That's the negotiating room, and it's narrow right now.
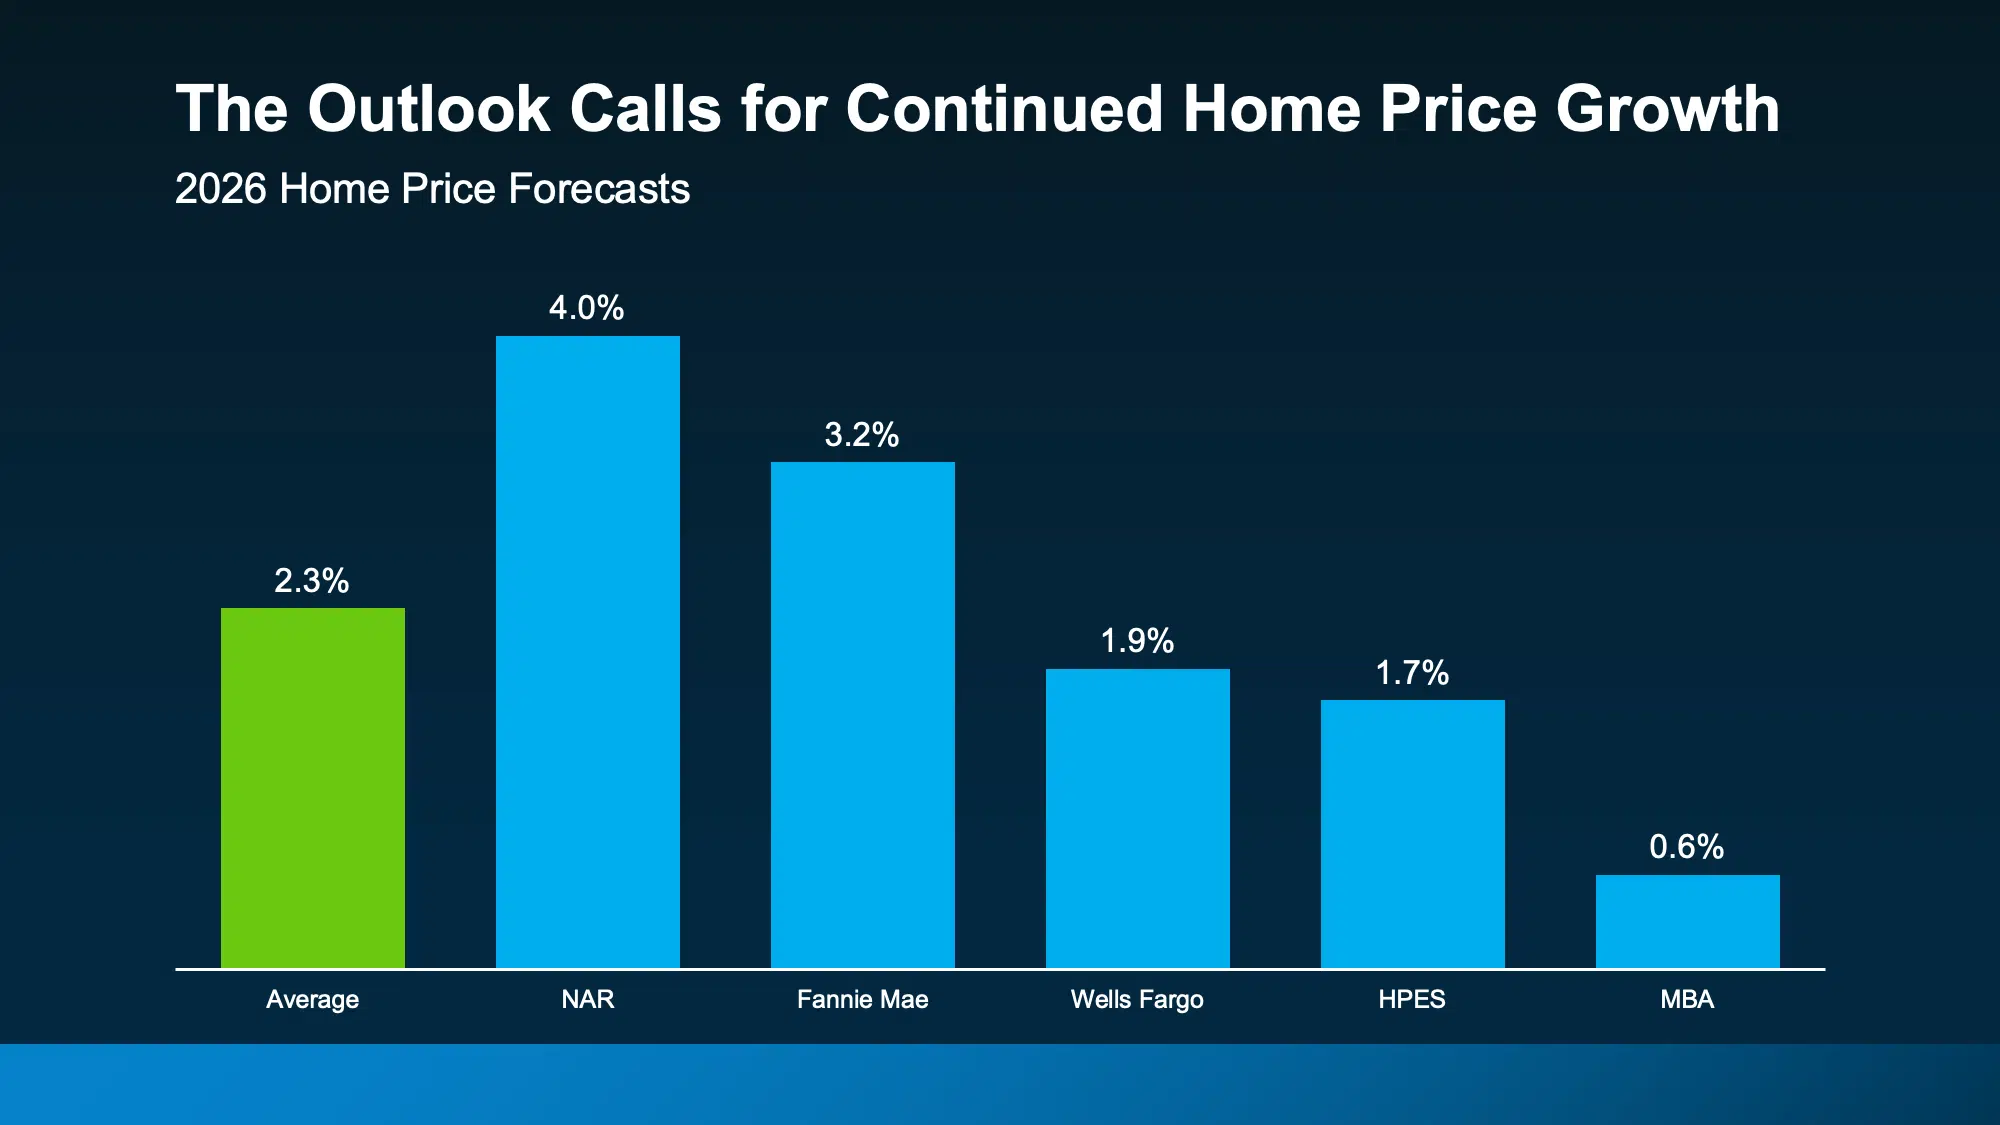
The forecasts back this up. Every major group expects national prices to rise in 2026, from 4% on the high end to under 1% on the low end. The idea that prices are falling nationally is a headline, not a fact. In a supply-tight Northeast market like ours, the case for meaningful price declines is even weaker.
Should I Wait for Lower Mortgage Rates to Buy a Shore House?
Waiting for rates is a bet, and right now it's a bad one. The consensus has the 30-year fixed sitting in the low-to-mid 6s through the end of 2026 and into 2027. There's no forecast on the table calling for a return to the 4s or 5s. If you're holding out for a number that isn't coming, you're paying rent or missing appreciation while you wait.
Here's the part that matters for the shore specifically. Rates barely move this market. A large share of shore buyers are second-home purchasers, and a meaningful chunk pay cash. Nationally, about a quarter of June buyers paid all cash. On the shore, at these price points, that share runs higher. When a buyer isn't financing, a 6.5% rate is background noise.
The structural piece is inventory. The Northeast has the tightest supply in the country, and the national homebuilding deficit still runs around 4 million homes, with the shortage most acute up here. The Sun Belt can flood itself with new construction to cool prices. A barrier island can't build its way out of anything. There's no more land. That scarcity is the shore's permanent advantage, and it's why waiting on rates rarely pays off here.
Is Now a Good Time to Sell a Shore Property?
In the tight towns, yes, if you price it right. The supply compression is doing the work for you. Fewer competing listings, buyers moving faster, and sold-to-list ratios in the high 90s all point the same direction.
The risk is the expectation gap, and it's the biggest seller mistake in this market. A recent survey found 80% of sellers think they'll get their asking price or more. The reality nationally is that 62% of homes sell for less than asking.
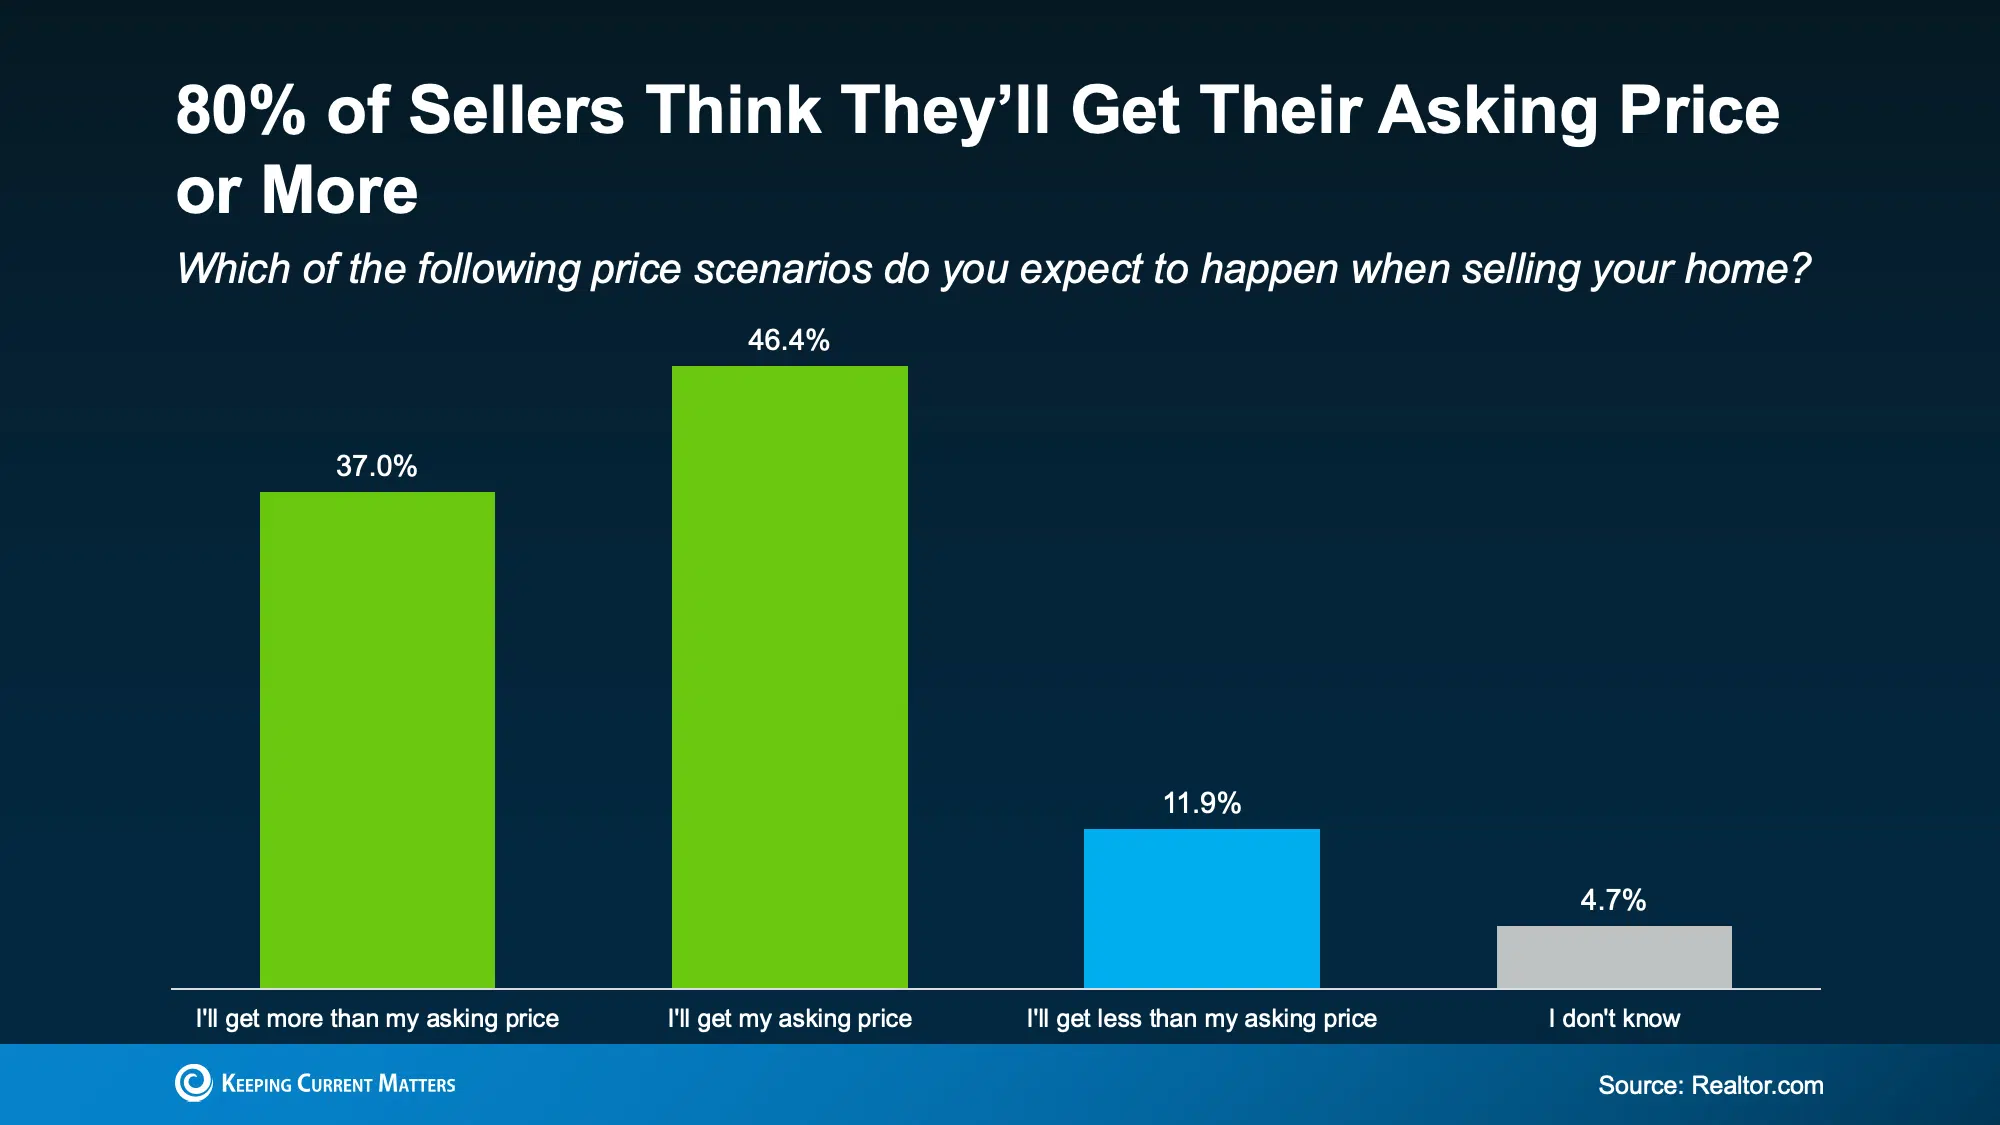
That gap is why so many sellers nationally are pulling homes off the market instead of adjusting. One housing researcher put it plainly:
"They have expectation on price, and if it's not being met, they'll just stay put. The move is not worth the cost." Dejan Eskic, Senior Research Fellow, Kem C. Gardner Policy Institute, University of Utah
Pulling a home doesn't solve anything. It just resets the clock and, in a lot of cases, the seller comes back later at the same price the market already rejected. On the shore, where the tight towns are genuinely favoring sellers, the winning move is to price against what's actually selling, not against what the neighbor listed at two summers ago. Do that and these markets reward you fast.
Is It a Good Time to Buy a Shore House in New Jersey?
It's a better time than the headlines suggest, and it depends heavily on which town you're chasing. In the loosening markets, Ventnor, Somers Point, the Atlantic County mainland, you have more supply and more room to negotiate than you did a year ago. That's a genuine opening.
In the tight island towns, the leverage isn't there, so the game changes. You don't win a Cape May City or a Brigantine on price. You win on terms and on speed. Get fully pre-approved before you shop. Be ready to move when the right listing hits, because at 20 to 24 days on market, hesitation costs you the house. And work with someone tracking new inventory in real time, not someone who calls you a week after it's already under contract.
The buyers doing well on the shore right now are the decisive ones. Not the ones waiting for a rate cut or a price crash that the data says isn't coming.
The Bottom Line
The national market is loosening. The South Jersey Shore mostly isn't, and where it is, it's the mainland, not the islands. Cape May County tightened hard, Atlantic County held flat, and the barrier-island resort towns are compressing while a few pockets loosened.
Supply across the shore fell from 4.3 months to 3.5. Homes are selling faster than they were last June, at 63 days versus 70. Prices are holding, with the disciplined towns closing in the high 90s as a share of list. And rates are going to sit in the 6s for the foreseeable future, which barely matters in a market this cash-heavy.
The single number to ignore is the national one, if you're making a shore decision on it. This market runs on its own physics: no land, steady demand, and a Northeast supply shortage that isn't going anywhere. Whether you're buying or selling, the right move is town-specific. That's the whole job.
Local Market Guides
Browse the Market by Town
Market data, listings, and local knowledge for every shore town in Cape May and Atlantic Counties.
Adam D'Annunzio is a Broker Associate with Keller Williams Realty Jersey Shore and has worked exclusively in the South Jersey Shore market since 2012, consistently ranking in the top 1% of agents in the area. He specializes in waterfront and second-home properties across Ocean City, Avalon, Stone Harbor, Sea Isle City, Cape May, Margate, Ventnor, Brigantine, the Wildwoods, and the surrounding barrier-island communities. For a town-specific read on your property or a target market, reach out here.