
Here’s what the national headlines are telling buyers right now: rates are stuck, inflation is sticky, sit tight and wait. Here’s what the May data from the South Jersey Shore is actually saying: months of supply is compressing, pending sales are surging, and homes are moving faster than they were a year ago.
That gap between the national narrative and what’s actually happening down here keeps getting wider. If you’re reading CNBC headlines and assuming things are slowing down at the shore, you’re watching the wrong movie.
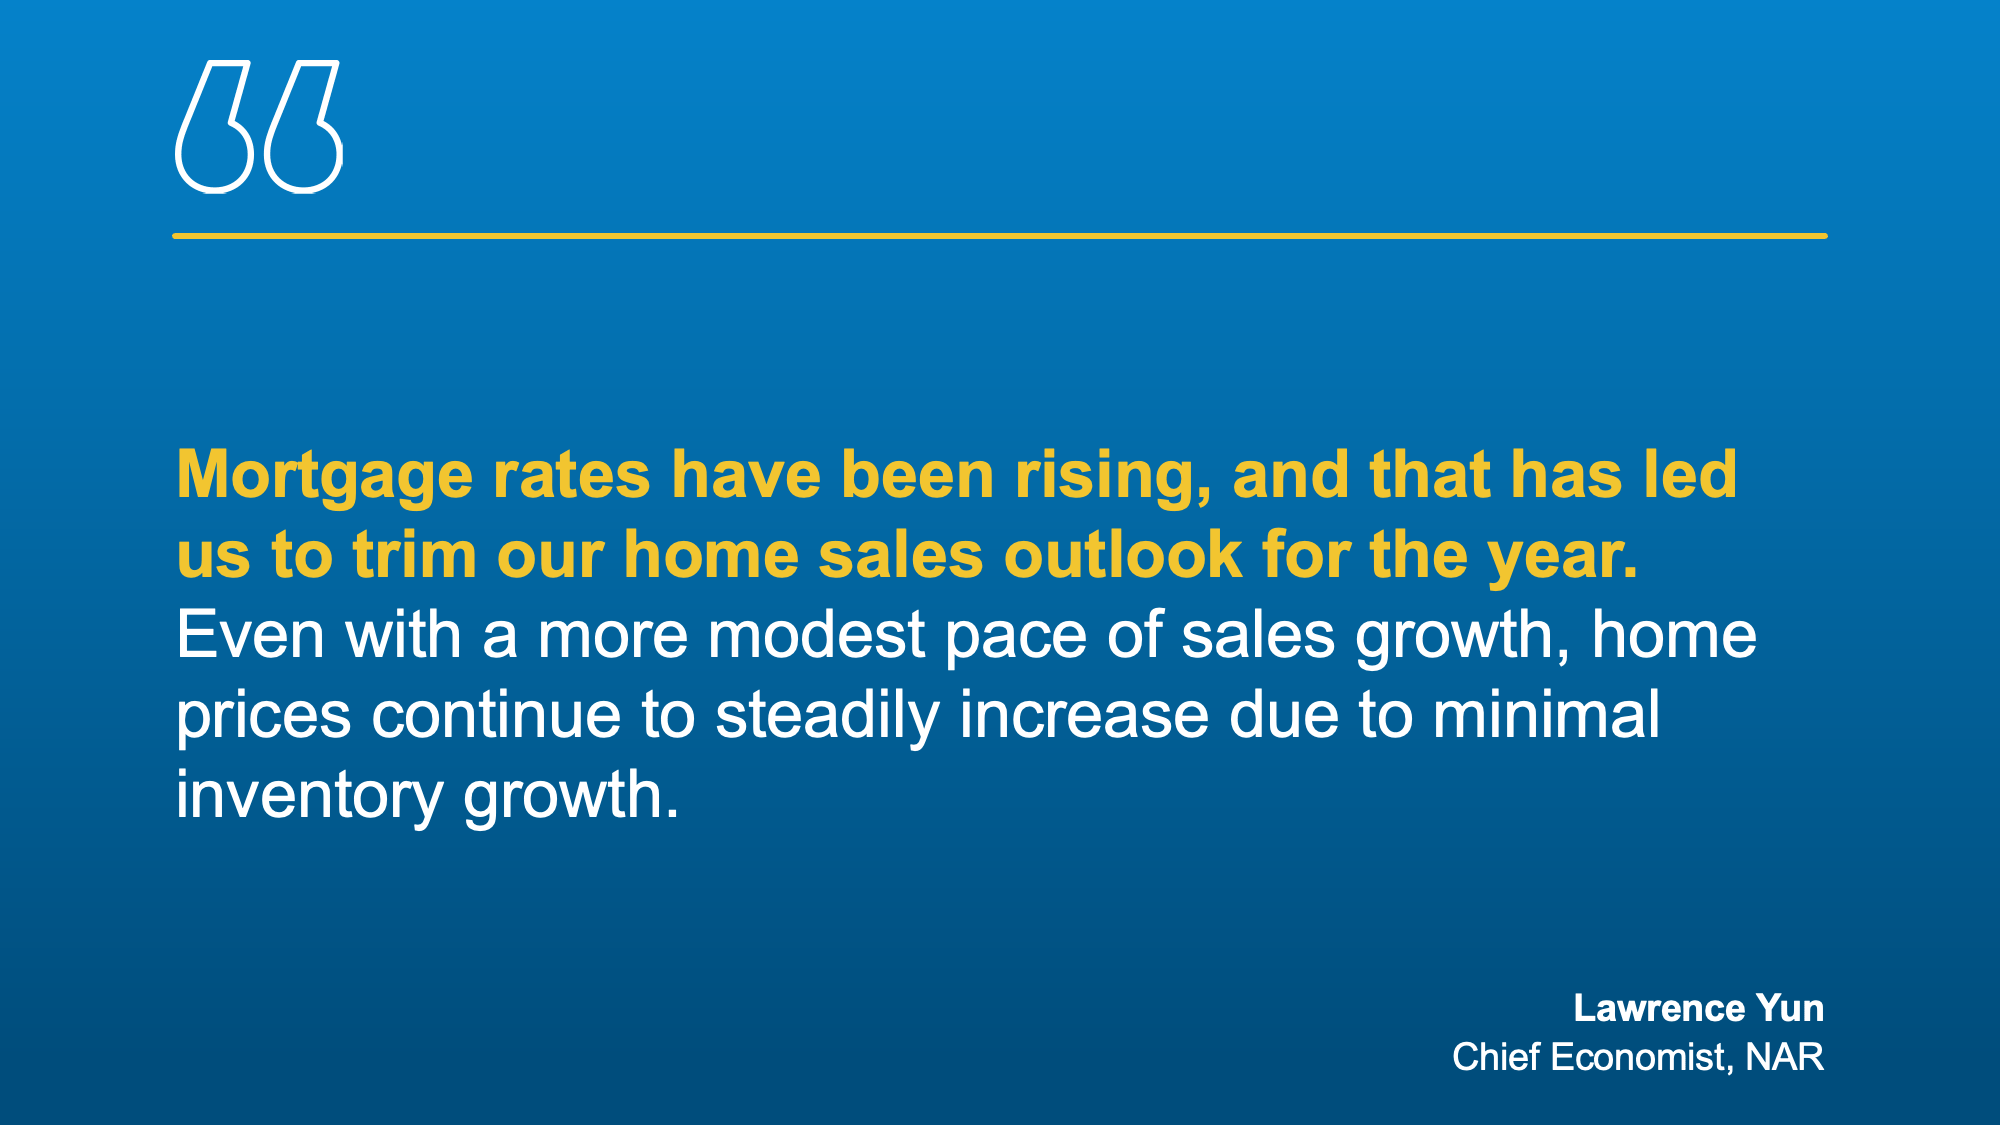
The 2026 national sales forecast has already been revised down from 5.2 million total sales to 4.9 million. Mortgage rates started the year forecast at 6% and have been revised up to 6.5%. The 30-year fixed averaged 6.44% in May. That rate environment is real. It’s weighing on activity across most of the country.
The shore market doesn’t need lower rates. The May numbers prove it.
What’s Happening in the National Housing Market Right Now?
Existing home sales rose 3.2% in May to a 4.17 million annual pace, the best month since December. Median home price hit a new May record at $429,300, up 1.3% year over year. Months of supply nationally sits at 4.5. That’s roughly balanced.
The forecast revisions tell a bigger story than the monthly numbers, though. The 2026 outlook started optimistic and has been trimmed across the board.
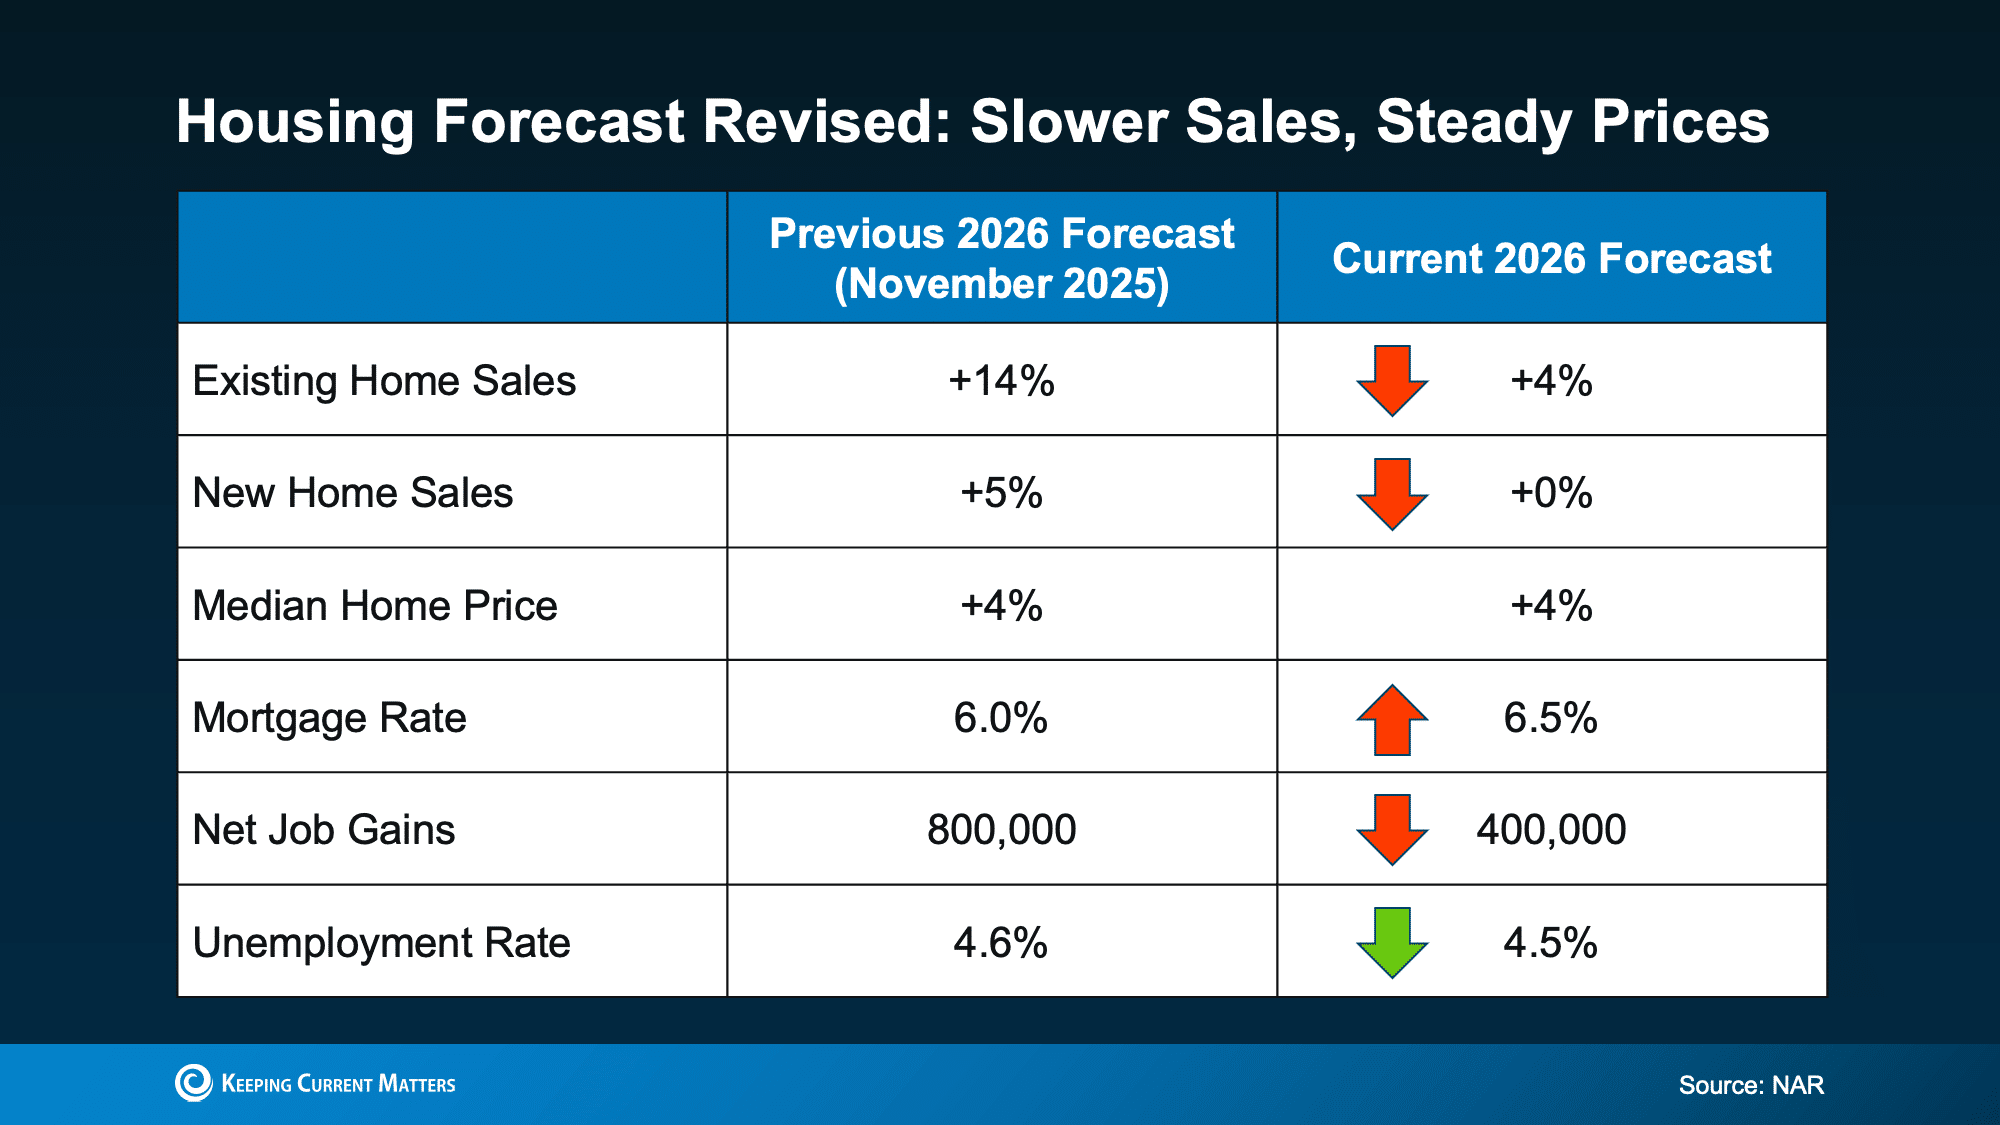
Existing home sales growth was initially projected at 14% for the year. That’s been cut to 4%. New home sales went from a projected 5% gain to flat. Mortgage rate projections went from 6% to 6.5%. Job gains were halved from 800,000 to 400,000.

Total projected home sales dropped from 5.2 million to 4.9 million. Existing home sales specifically got cut from 4.5 million to 4.2 million. That’s not noise. It reflects a national buyer pool dealing with affordability pressure, economic uncertainty, and the slow realization that 6.5% rates aren’t a temporary situation.
On inflation: May’s CPI came in at 4.2% annually, the highest since April 2023. That’s above 4% for the first time in three years. Core CPI, stripping out food and energy, held at 2.9%. The headline number was driven by energy costs, but the core reading was actually slightly better than expected. That matters for rate forecasts because the Fed watches core more closely than headline.
Where are rates going? Every major forecaster has now converged on the same message: mid-6s for a while. Fannie Mae and Wells Fargo both project 6.2% by Q4 2027. The Mortgage Bankers Association is higher at 6.5%. As of the first week of June, the 30-year fixed stood at 6.48%. Nobody credible is forecasting sub-5% rates anytime soon.
Inventory nationally is up just 2.2% year over year and remains 10.4% below pre-pandemic 2019 levels. But the regional picture is sharply divided. The South and Mountain West have seen inventory recover, in some cases exceeding 2019 levels. The Northeast and Midwest remain structurally tight, with limited new construction and less exposure to the pandemic migration pullback. New Jersey falls firmly in that tight category.
How Is the South Jersey Shore Housing Market Doing?
The combined Atlantic and Cape May county data tells a completely different story than the national numbers.
Atlantic County, May 2026: Months of supply at 4.26, down 6.4% year over year. Median sold price $420,000. Sold-to-list ratio 97.9%. Median days on market 23. Active listings 1,419 with 351 new pendings in May.
Cape May County, May 2026: Months of supply at 3.96, down 21.4% year over year. Median sold price $724,500. Sold-to-list ratio 98.2%. Median days on market 29. Active listings 997 with 272 new pendings in May.
Read that Cape May number again. Months of supply dropped more than 21% in twelve months. That’s not a market waiting for anything. That’s a market absorbing inventory faster than it’s being replenished.
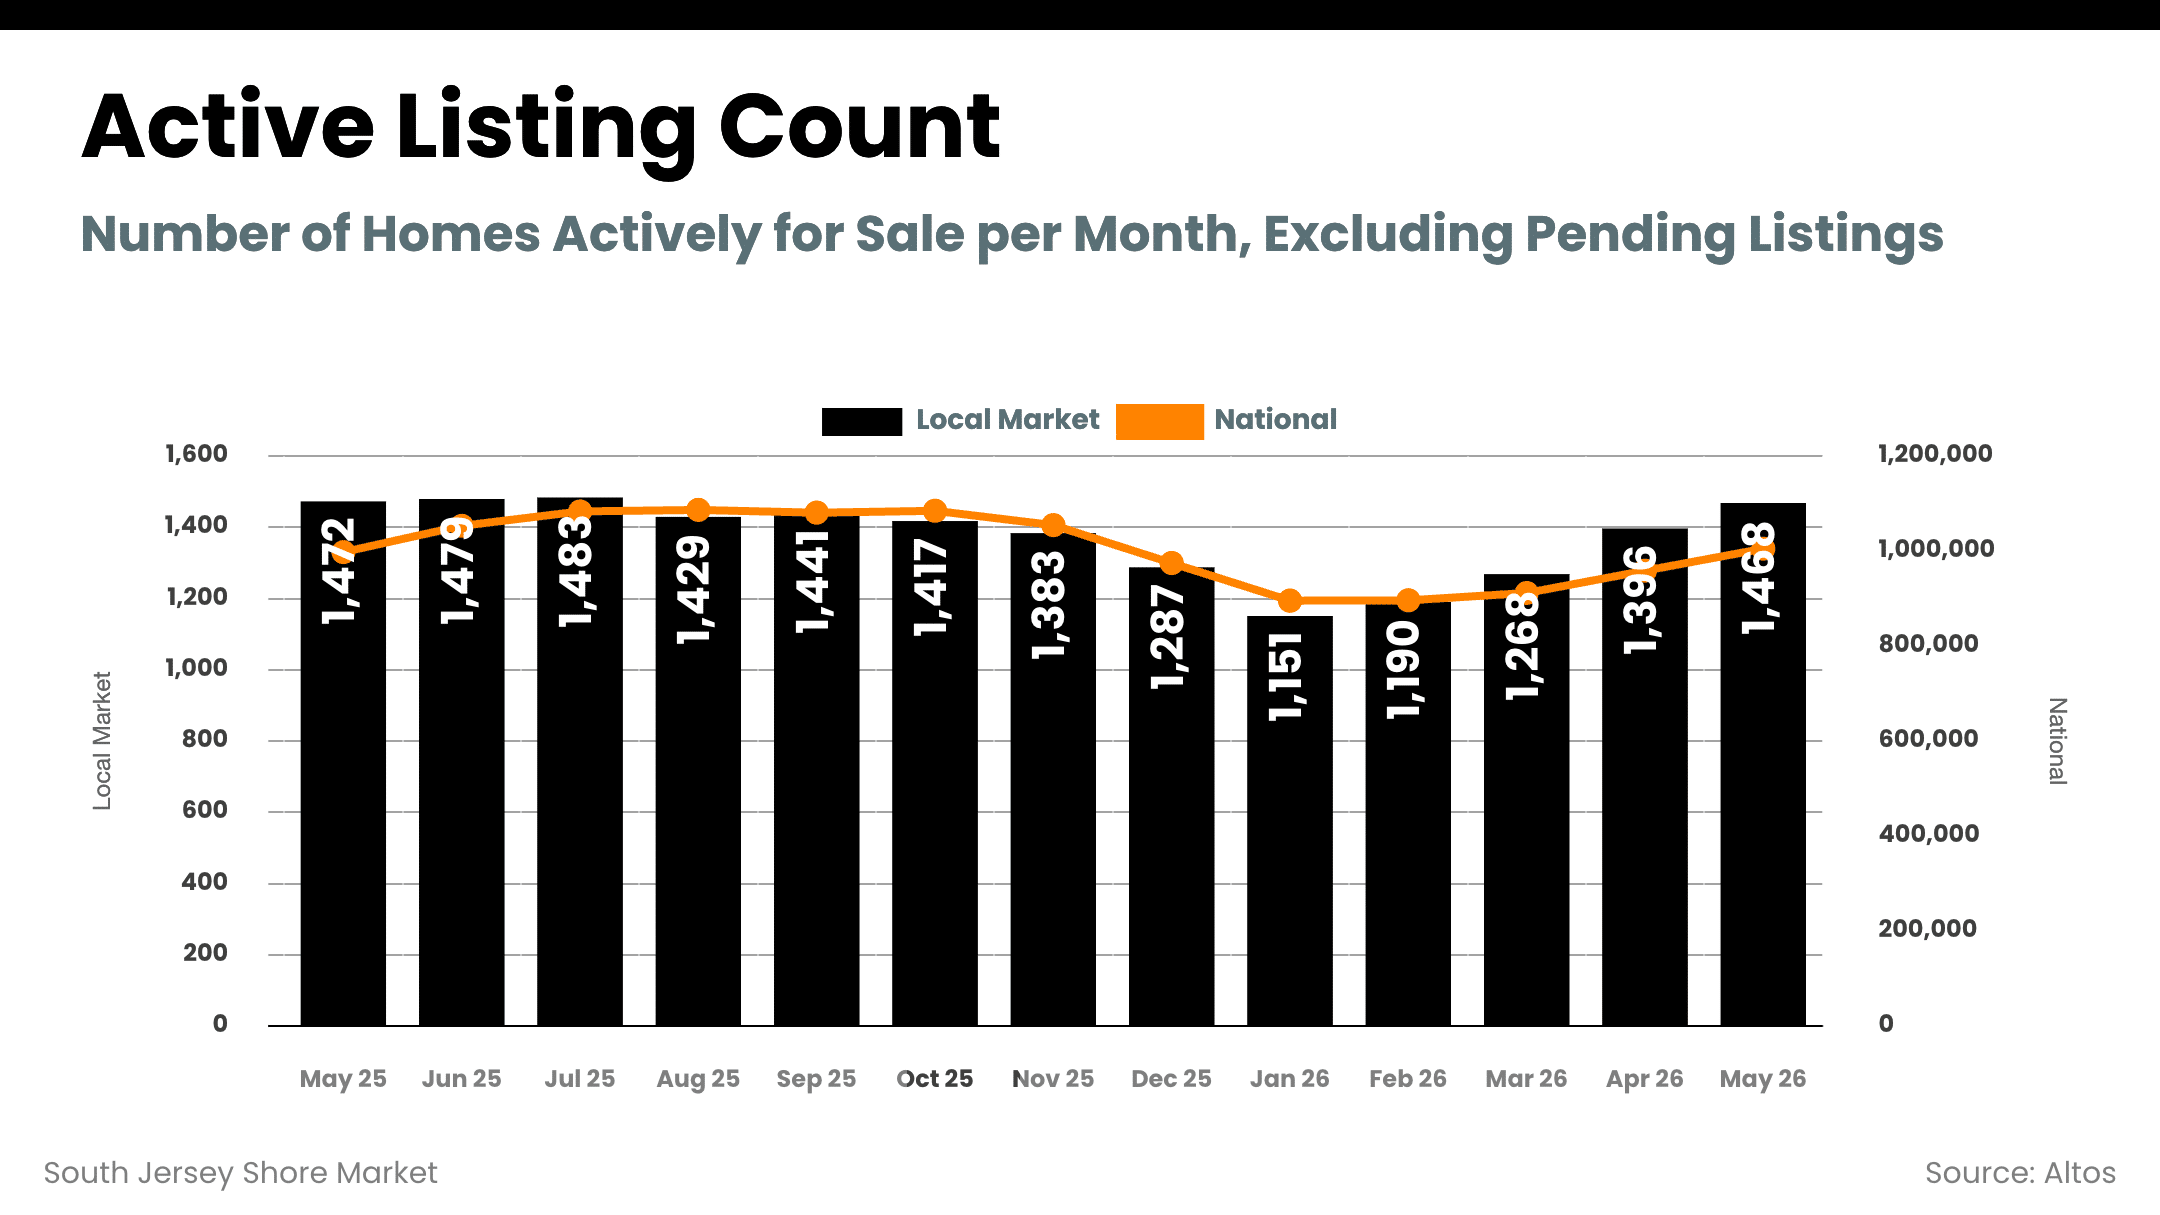
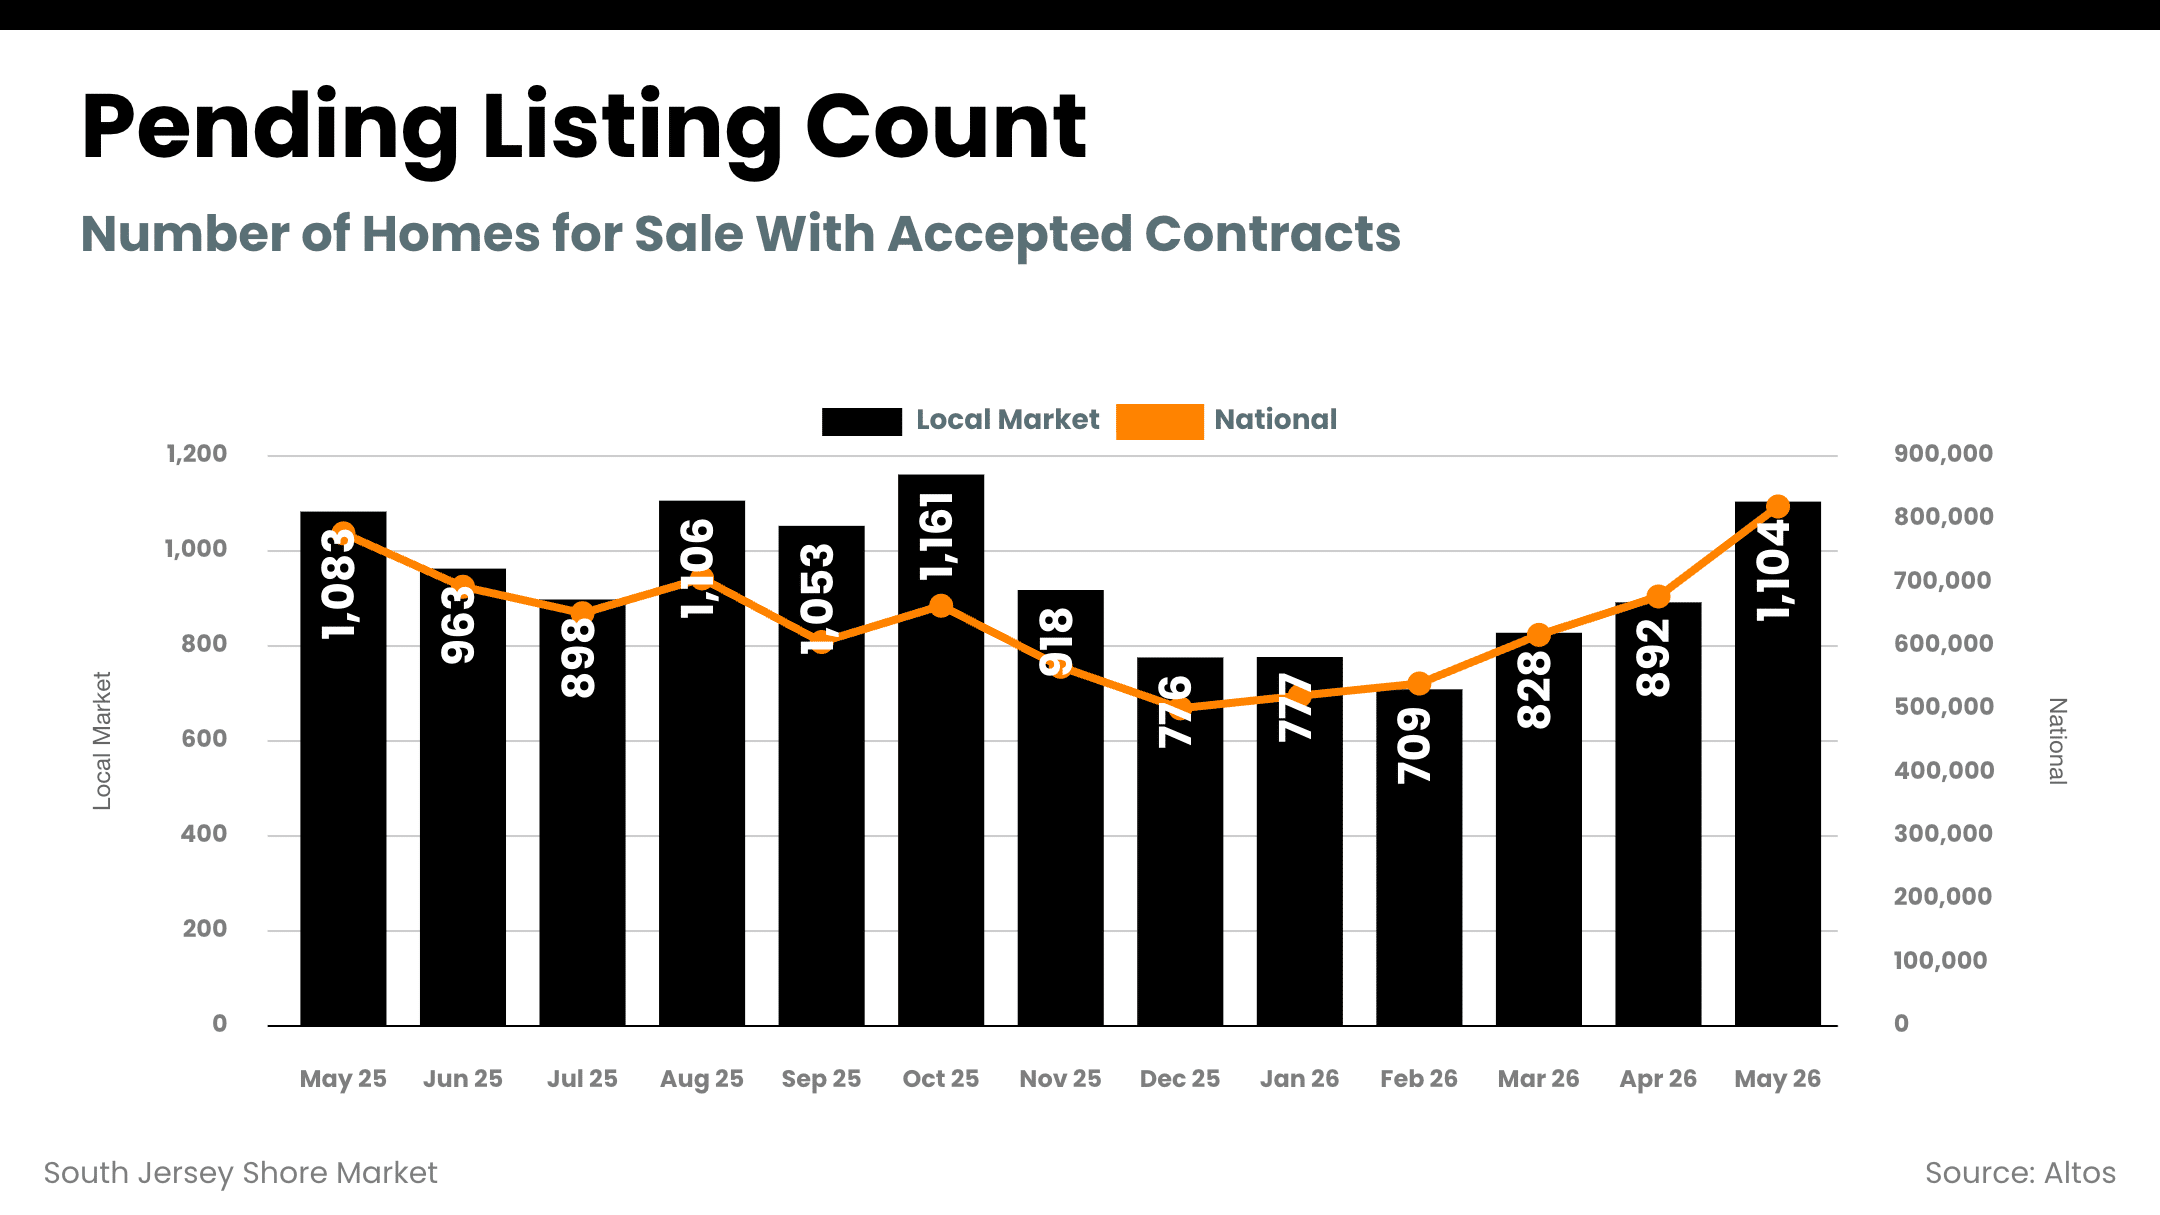
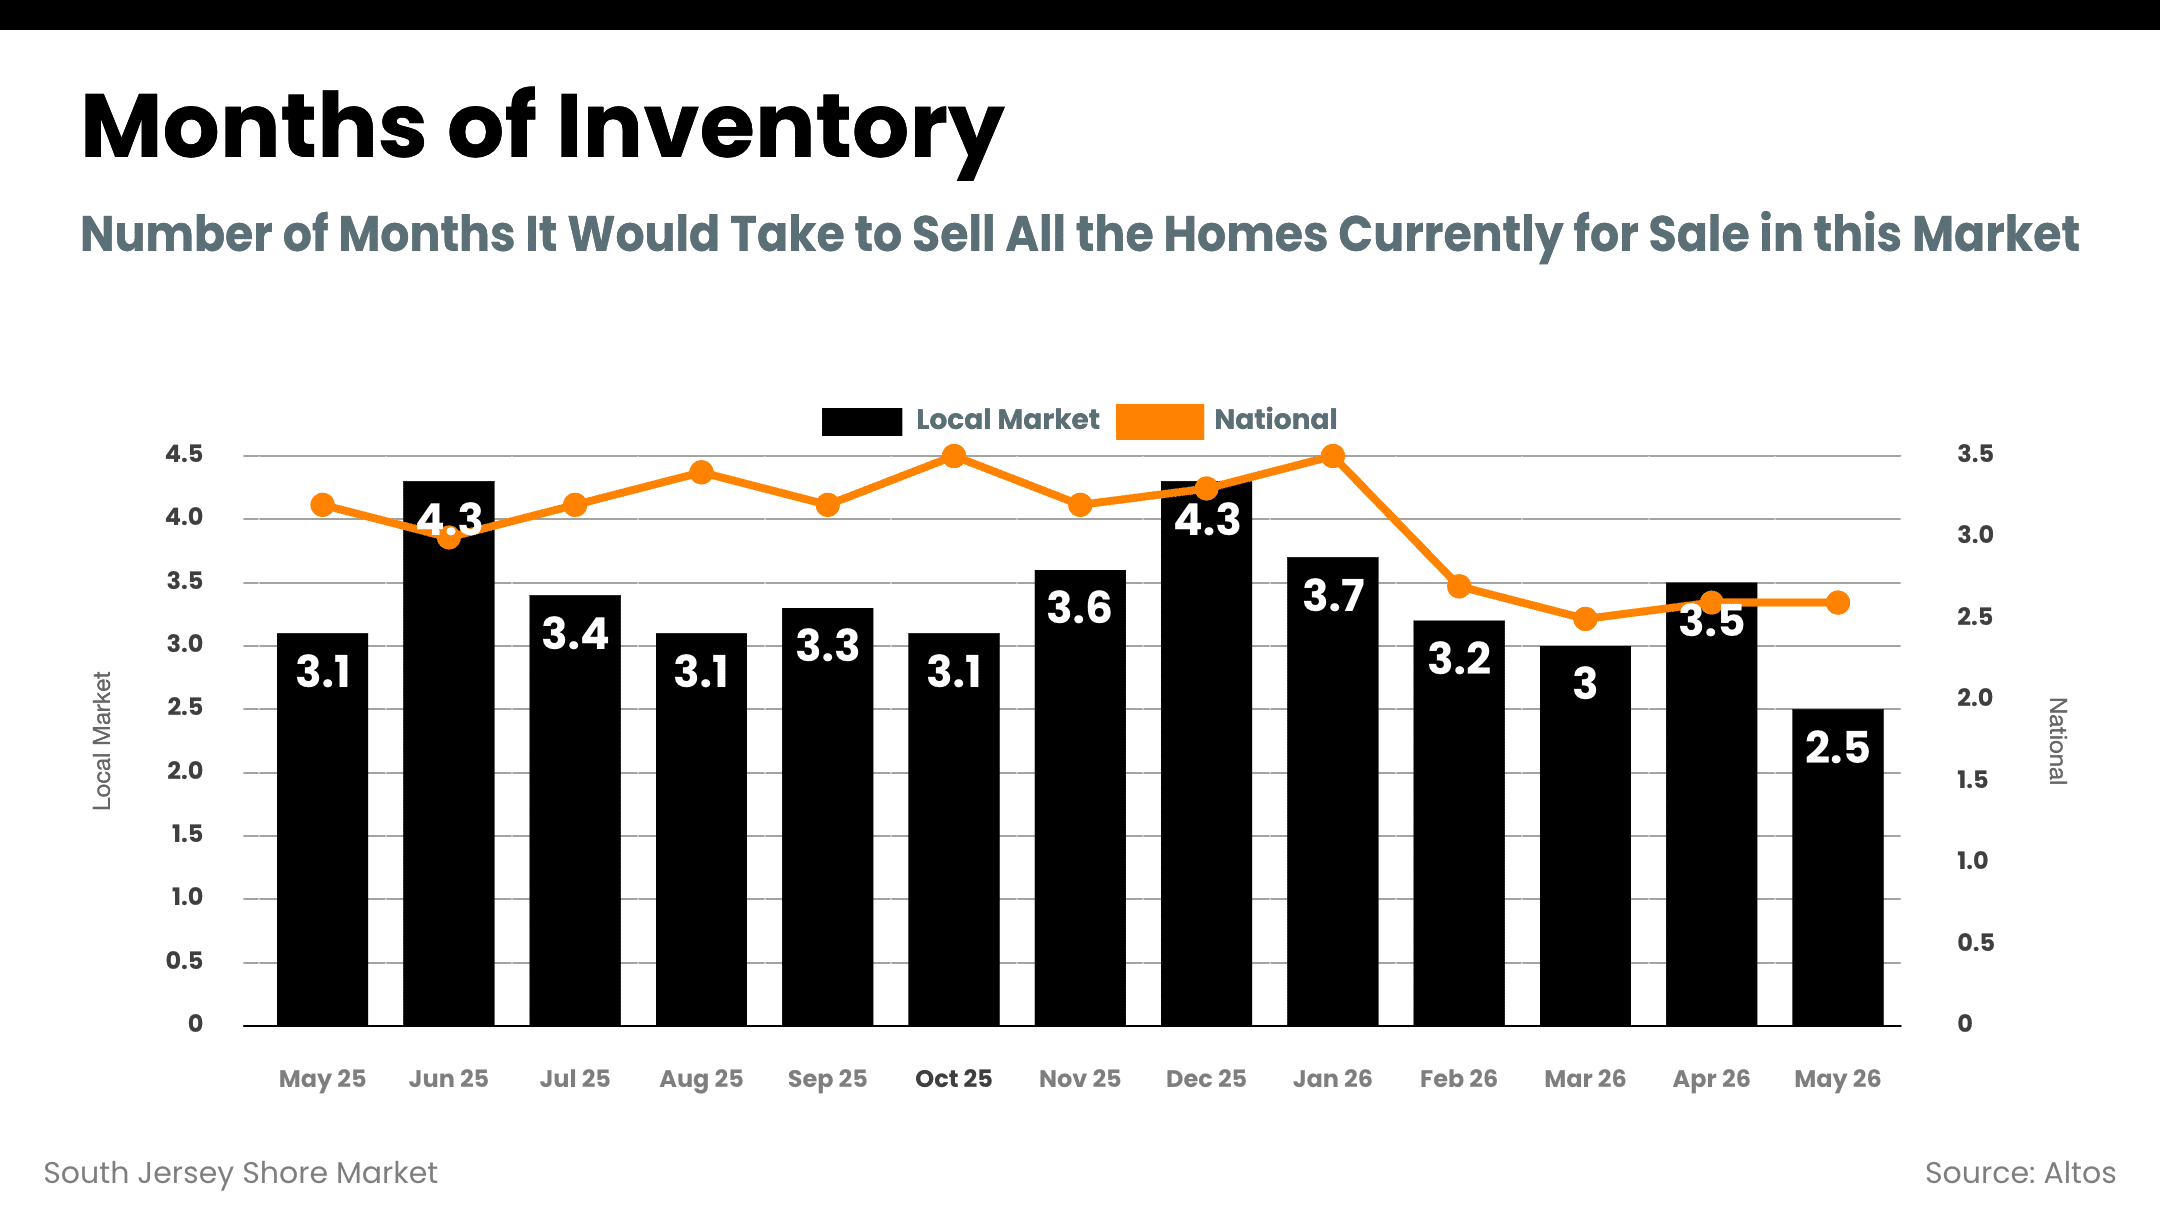
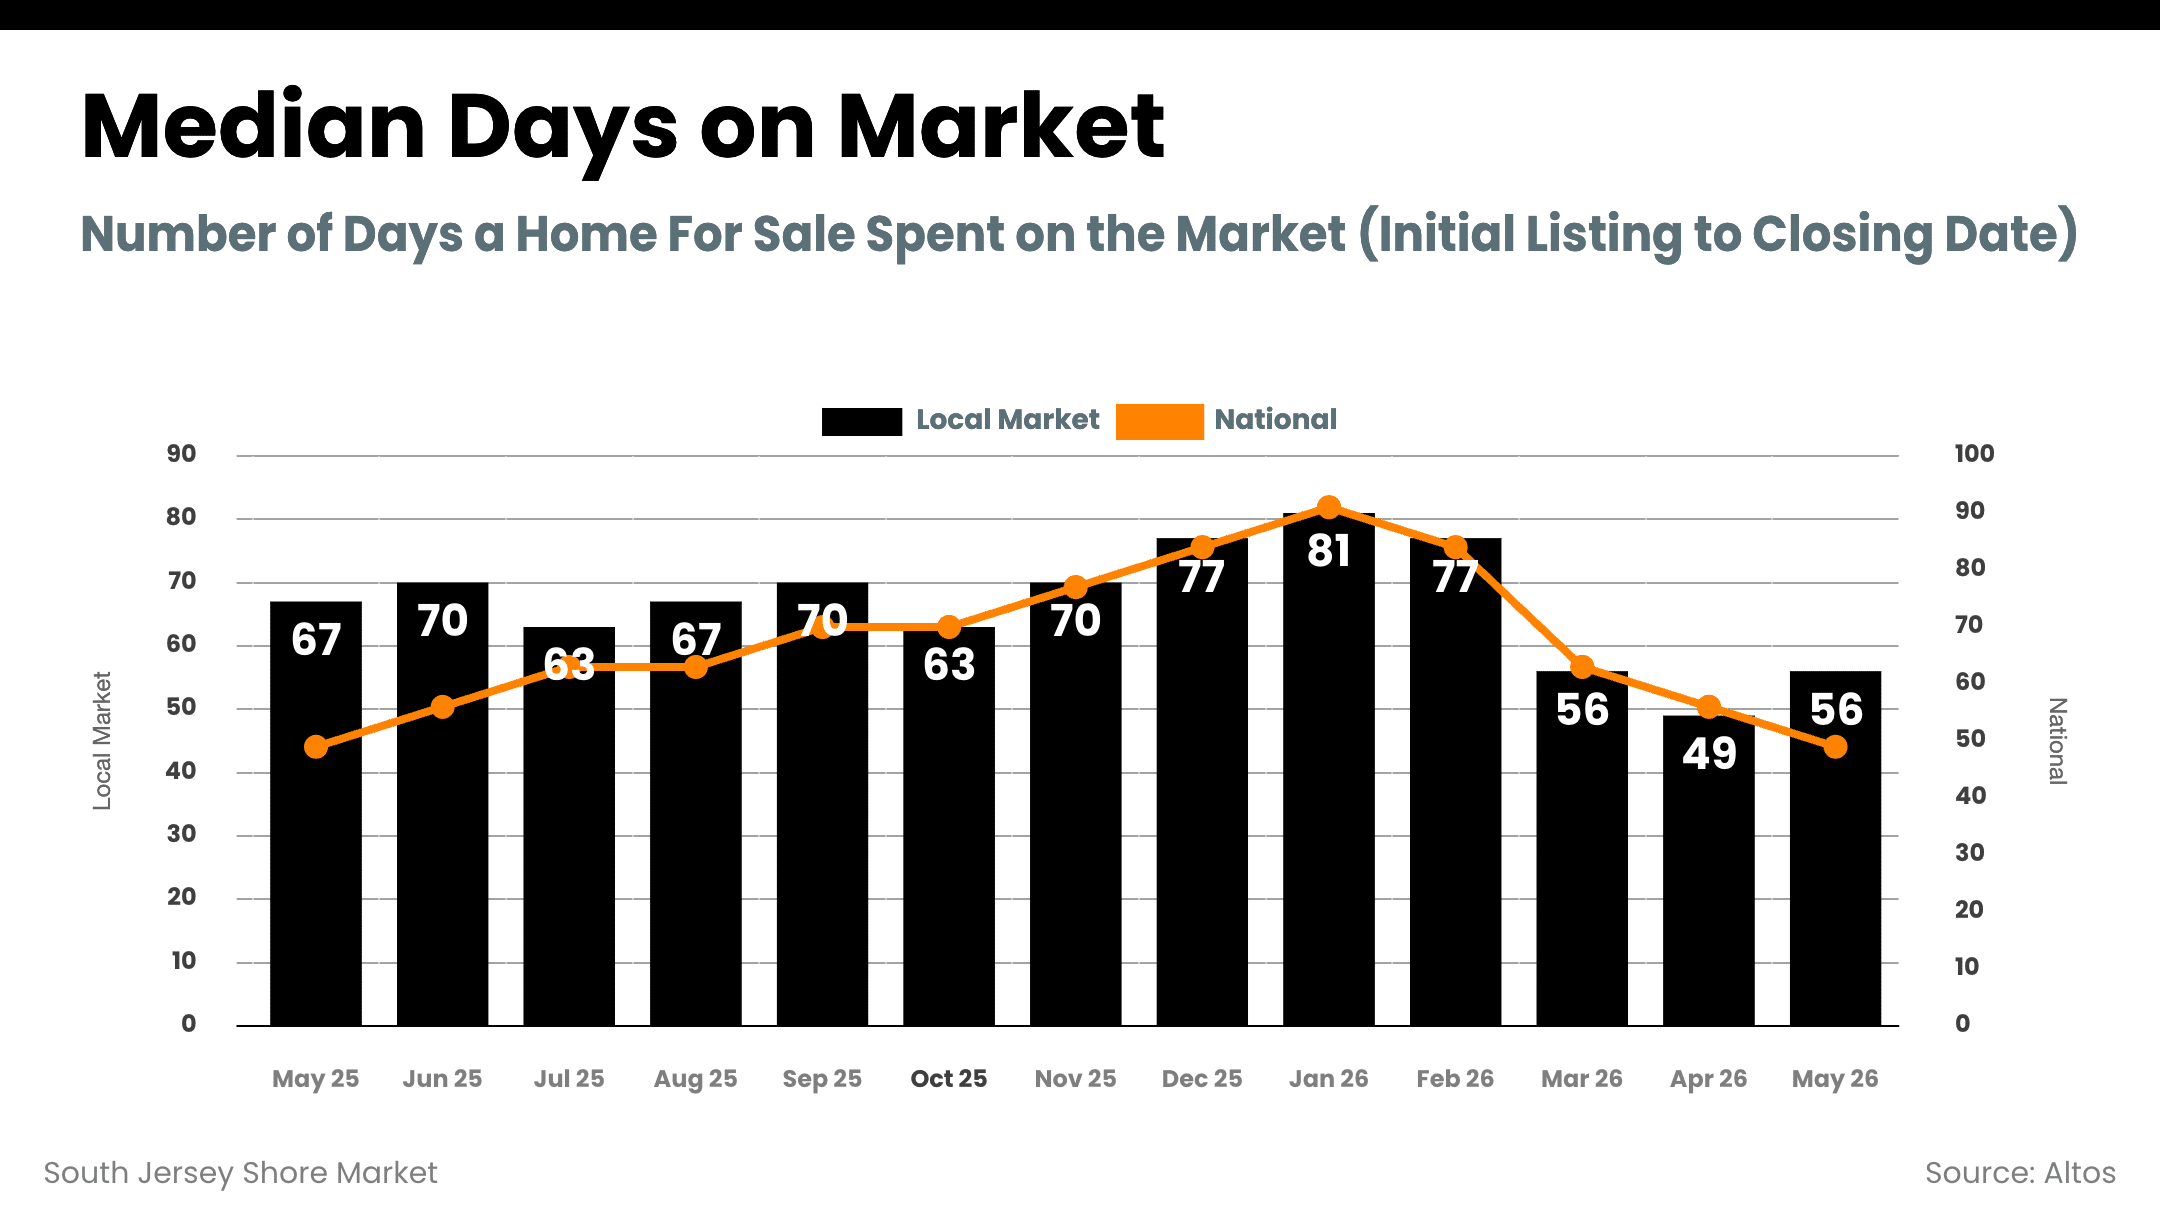
Across the broader shore market, local trend data shows 1,488 active listings in May, with 1,104 pending sales. The local months of inventory reading dropped to 2.5 in May, well below the national 4.5 figure and firmly in seller’s market territory. Local median days on market came in at 56 for the broader composite, though individual towns are often much faster.
First-time buyers comprised 35% of national sales in May, up from 30% a year ago. Down here, the buyer profile is different. This is a second-home and investment market driven by CPAs, financial advisors, business owners, and families who’ve been watching the shore for years. About 25% of national buyers paid all cash in May, and on the shore that percentage runs even higher.
Which Shore Towns Are the Hottest Right Now?
Ocean City continues to be the volume leader across the shore. 292 active listings, 61 new pendings in May, median sold price $1.14 million, sold-to-list 97.5%, and days on market at just 27. Months of supply sits at 4.95, down 11% year over year. At this price point and volume, OC is functioning as efficiently as any resort market on the East Coast.
Avalon is telling the most dramatic supply story on the island. Months of supply cratered to 4.29, down 48% year over year. Median sold price $1.9 million, sold-to-list 95.3%, 60 active listings with 12 pendings. Days on market is 142, which reflects the price tier. Properties over $1.5 million take longer to close, but when they do, sellers are getting very close to ask. The supply compression here is significant.
Sea Isle City is the tightest market on the shore right now. 2.71 months of supply. Median sold price $2.14 million, sold-to-list 98.8%, DOM 46. Only 38 active listings against 11 new pendings. When buyers want Sea Isle, they’re competing for limited options, and the sold-to-list ratio shows they’re paying very close to asking.
Cape May City tightened meaningfully this spring. Months of supply dropped to 3.07, down 24% year over year. Median sold price $721,000, sold-to-list at 100.6%, meaning buyers are consistently paying above ask. 86 active listings, 40 new pendings, DOM at 24 days. That’s fast for Cape May. Very fast.
Margate sits at 5.81 months of supply, down 6% year over year but still the most relaxed market among the priority towns. Median sold $1.25 million, sold-to-list 93.6%, DOM 33. With 93 active and 15 pendings, Margate has more breathing room for buyers, though the sold-to-list ratio at 93.6% suggests some sellers are still pricing above where the market is willing to go.
Wildwood Crest is one of only two priority markets where inventory is growing. Months of supply is 5.2, up 12% year over year. Median sold $701,000, sold-to-list 96%, DOM 33. With 78 active and 30 pendings, there’s decent activity, but the rising inventory trend is worth watching. If you’ve been priced out of other shore towns, Crest offers relative value.
Ventnor has been flat year over year on months of supply at 5.53. Median sold $510,000, sold-to-list 96.2%, DOM 45. At 94 active and 13 pendings, absorption is modest. Ventnor remains the most affordable of the barrier island towns and tends to attract buyers looking at the $400K to $600K range.
Somers Point is steady. 4.13 months of supply, down 4% year over year. Median sold $450,000, sold-to-list 98.3%, DOM just 20 days. 62 active, 16 pendings. It’s not flashy, but it’s efficient. Homes priced right in Somers Point are gone in under three weeks.
Elsewhere on the shore: Brigantine saw months of supply collapse to 3.63, down 37.8% year over year, with a median sold of $590K and DOM of just 17 days. Egg Harbor Township is running at 3.0 months of supply with 165 active and 67 pendings, one of the most active mainland markets. Upper Township dropped to 3.44 months of supply, a 46% year-over-year compression, with sellers getting 100.9% of asking. North Cape May at 2.4 months is one of the tightest pockets in the region, down 45% year over year. Longport is the outlier at 9.0 months of supply, up 17%, with just 1 new pending against 27 active listings. Low sample size, but if you’re watching Longport, there’s room to negotiate.
| Town | Months of Supply | YoY Change | Median Sold | Sold/List | DOM |
|---|---|---|---|---|---|
| Sea Isle City | 2.71 | — | $2.14M | 98.8% | 46 |
| Cape May City | 3.07 | -24% | $721K | 100.6% | 24 |
| Brigantine | 3.63 | -37.8% | $590K | — | 17 |
| Somers Point | 4.13 | -4% | $450K | 98.3% | 20 |
| Avalon | 4.29 | -48% | $1.9M | 95.3% | 142 |
| Ocean City | 4.95 | -11% | $1.14M | 97.5% | 27 |
| Wildwood Crest | 5.20 | +12% | $701K | 96.0% | 33 |
| Ventnor | 5.53 | 0% | $510K | 96.2% | 45 |
| Margate | 5.81 | -6% | $1.25M | 93.6% | 33 |
SOUTH JERSEY SHORE
Months of Supply: Year-Over-Year Change
May 2026 Data
Blue = supply compressing (seller advantage). Orange = supply expanding. Source: RPR Market Activity Reports.
Are Home Prices Dropping at the Jersey Shore?
National home price growth has been slowing for 12 straight months. Over half of major U.S. markets posted year-over-year price declines this spring. If you only read the national data, you’d think the pricing cycle has peaked.
It hasn’t here. Cape May County’s median sold price hit $724,500 in May. Atlantic County came in at $420,000. Both counties are in seller’s market territory. The sold-to-list ratios, 97.9% in Atlantic and 98.2% in Cape May, tell you buyers are paying essentially what sellers are asking.
Here’s the local translation of that dynamic. On a $1.1 million home in Ocean City with a 97.5% sold-to-list ratio, buyers are typically settling within $27,500 of the asking price. In Cape May, where the ratio exceeds 100%, buyers are paying above list. In Sea Isle at 98.8%, on a $2.14 million median, that’s a gap of roughly $25,000. These aren’t distressed negotiations. They’re competitive transactions at real numbers.
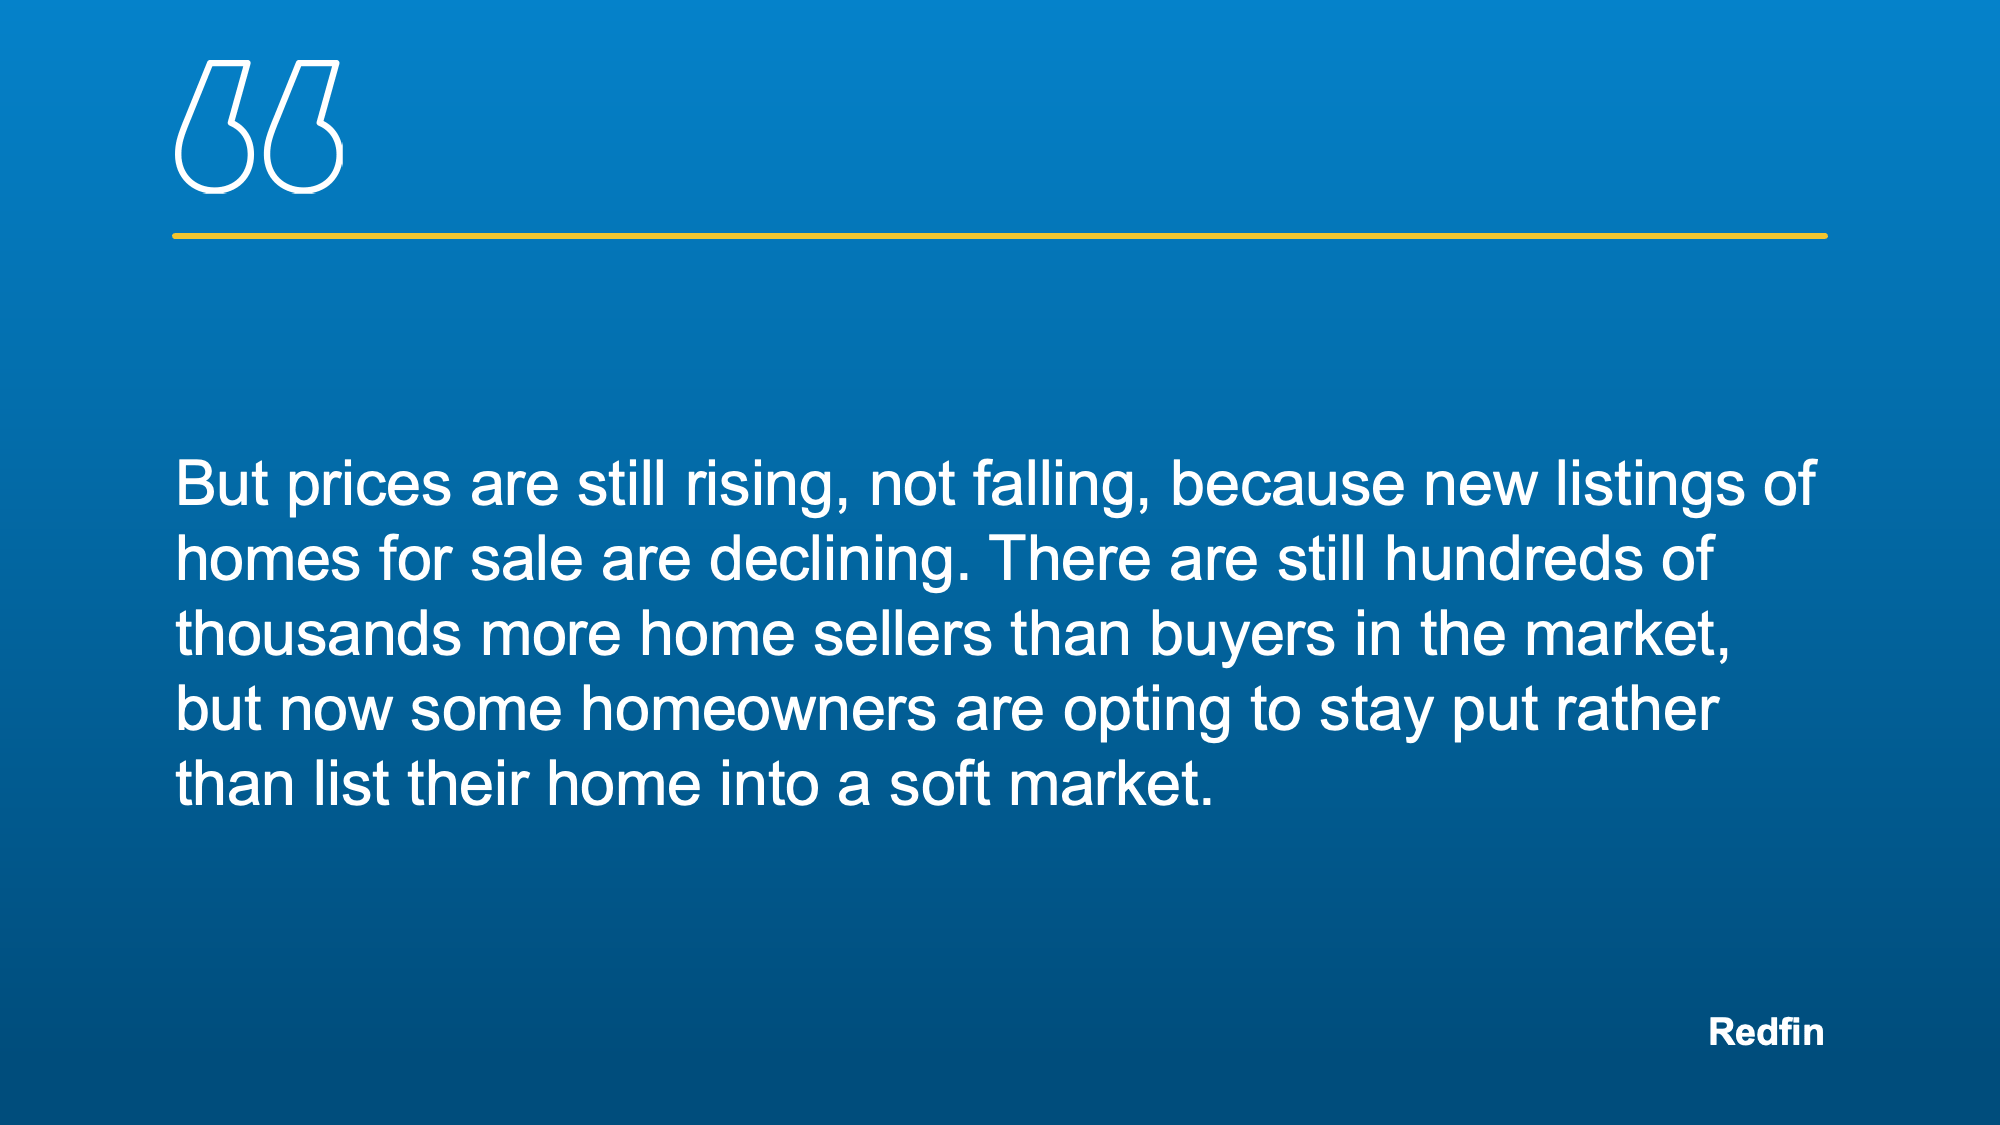
Why is the shore different? Inventory. It comes down to inventory every time. Nationally, active listings are rebuilding, up 2.2% year over year. Parts of the South and Mountain West have blown past pre-pandemic supply levels. The Northeast hasn’t. New Jersey doesn’t have the new construction pipeline that’s loosening markets in Texas and Florida. The supply we have is the supply we get. Demand keeps outpacing it.
Should I Wait for Lower Mortgage Rates to Buy at the Shore?
I keep hearing the same question: shouldn’t 6.5% rates be slowing things down more?
They are. Nationally. But the shore is a different animal, and the data explains why.
Start with who’s actually buying here. A huge share of shore transactions are second-home purchases by people who carry significant equity in a primary residence or pay cash outright. The typical American homeowner has accumulated about $128,000 in housing wealth over the past six years. 40% of U.S. homes are owned free and clear. Shore buyers skew well above those averages. When you’re putting 40% down, the difference between 6% and 6.5% on your monthly payment isn’t what’s driving the decision.
Then there’s the supply side. The Atlantic City metro ranked 10th nationally for retaining pandemic-era luxury price gains. The 90th-percentile luxury threshold went from $1.3 million in February 2020 to $2.5 million today, holding 73.4% of that run-up. Northeast markets that remain undersupplied are still seeing the kind of price stability that Texas, Florida, and Colorado have already lost.
And people don’t stop living because rates are high. In a two-year span nationally: 7 million births, 7 million people turning 65, 3 million marriages, 1.5 million divorces. On the shore, add retirement relocations, family homes being passed down and sold, and second-home purchases tied to career milestones. Rates matter, but they’re not the only variable in the equation. For a lot of buyers here, they’re not even the most important one.
The broader structural picture reinforces all of this. The U.S. housing market sits at $48 trillion in value with $34 trillion in equity against $14 trillion in mortgage debt. Two-thirds of homeowners either own free and clear or have at least 50% equity. There are no forced sellers. That floor under prices isn’t going anywhere.
Is Now a Good Time to Sell a Shore Property?
The pricing window is narrow and it rewards precision. Homes priced competitively are drawing strong interest. Some are getting multiple offers above ask. Homes priced even 5% above where the market actually is? Those are sitting, and the longer they sit, the more leverage shifts to the buyer. The data is consistent on this: the market tells you where you stand within about 14 days.
Supply compression is working in your favor right now. Cape May County’s months of supply is down 21% year over year. In Brigantine, Sea Isle, and Upper Township, it’s down 38% to 46%. Fewer competing listings means more eyeballs on yours and less negotiating leverage for the other side.
The buyers who are out there right now aren’t browsing. They’re making decisions driven by life changes, they’re qualified, and they’re ready to move. Nationally, about a quarter of homes sold above list price in May and homes received an average of 2.3 offers. Your home needs to show well to capture that demand. Deferred maintenance, dated finishes, poor photos. All of it gives a buyer a reason to negotiate harder.
Is It a Good Time to Buy a Shore House in New Jersey?
If you’re waiting for rates to come down before you make a move, the data doesn’t support the strategy. Every major forecaster projects mid-6s through at least late 2027. You’re not competing against tomorrow’s rates. You’re competing against other buyers who’ve accepted that reality and are already writing offers.
The shore market is tightening, not loosening. Months of supply dropped in the majority of tracked towns year over year. That window of more inventory and slightly more leverage that existed in late 2024 and early 2025 has been closing steadily. If you see something that checks the boxes, hesitation costs you.
Where you do have room to work: terms. In a 97-98% sold-to-list environment, you’re probably not getting a big price discount. But rate buydowns, closing cost credits, and timeline flexibility are all real levers. A well-structured offer with the right terms can get you to the same effective cost as a lower price without ever asking for one.
Worth keeping in perspective: 17 states currently have inventory above pre-pandemic levels. Half of major metros are seeing price declines. The shore remains undersupplied with stable pricing. That’s a fundamentally strong place to put capital right now, regardless of where rates sit.
The Bottom Line
Rates are higher than anyone expected at the start of the year. Sales forecasts have been cut. Inflation crossed 4% again. Half the country’s major markets are seeing flat or declining prices. All of that is true.
None of it describes what’s happening on the South Jersey Shore.
Cape May County’s months of supply dropped 21% in a year. Brigantine’s dropped 38%. Sea Isle is at 2.71 months. Buyers are paying 97-100% of asking prices. Median days on market in most towns is under 30 days. The market isn’t waiting for permission from the Federal Reserve to function. It’s already functioning.
Adam D’Annunzio is a top 1% REALTOR with Keller Williams Realty Jersey Shore, specializing in South Jersey Shore barrier island and coastal communities. He provides monthly market analysis for Ocean City, Avalon, Sea Isle City, Cape May, Margate, Wildwood Crest, Brigantine, Ventnor, Somers Point, Stone Harbor, and surrounding communities.
Local Area Market Reports (updated every 48 hours)