
For two years the housing conversation was about when the Fed would cut. That conversation ended in August.
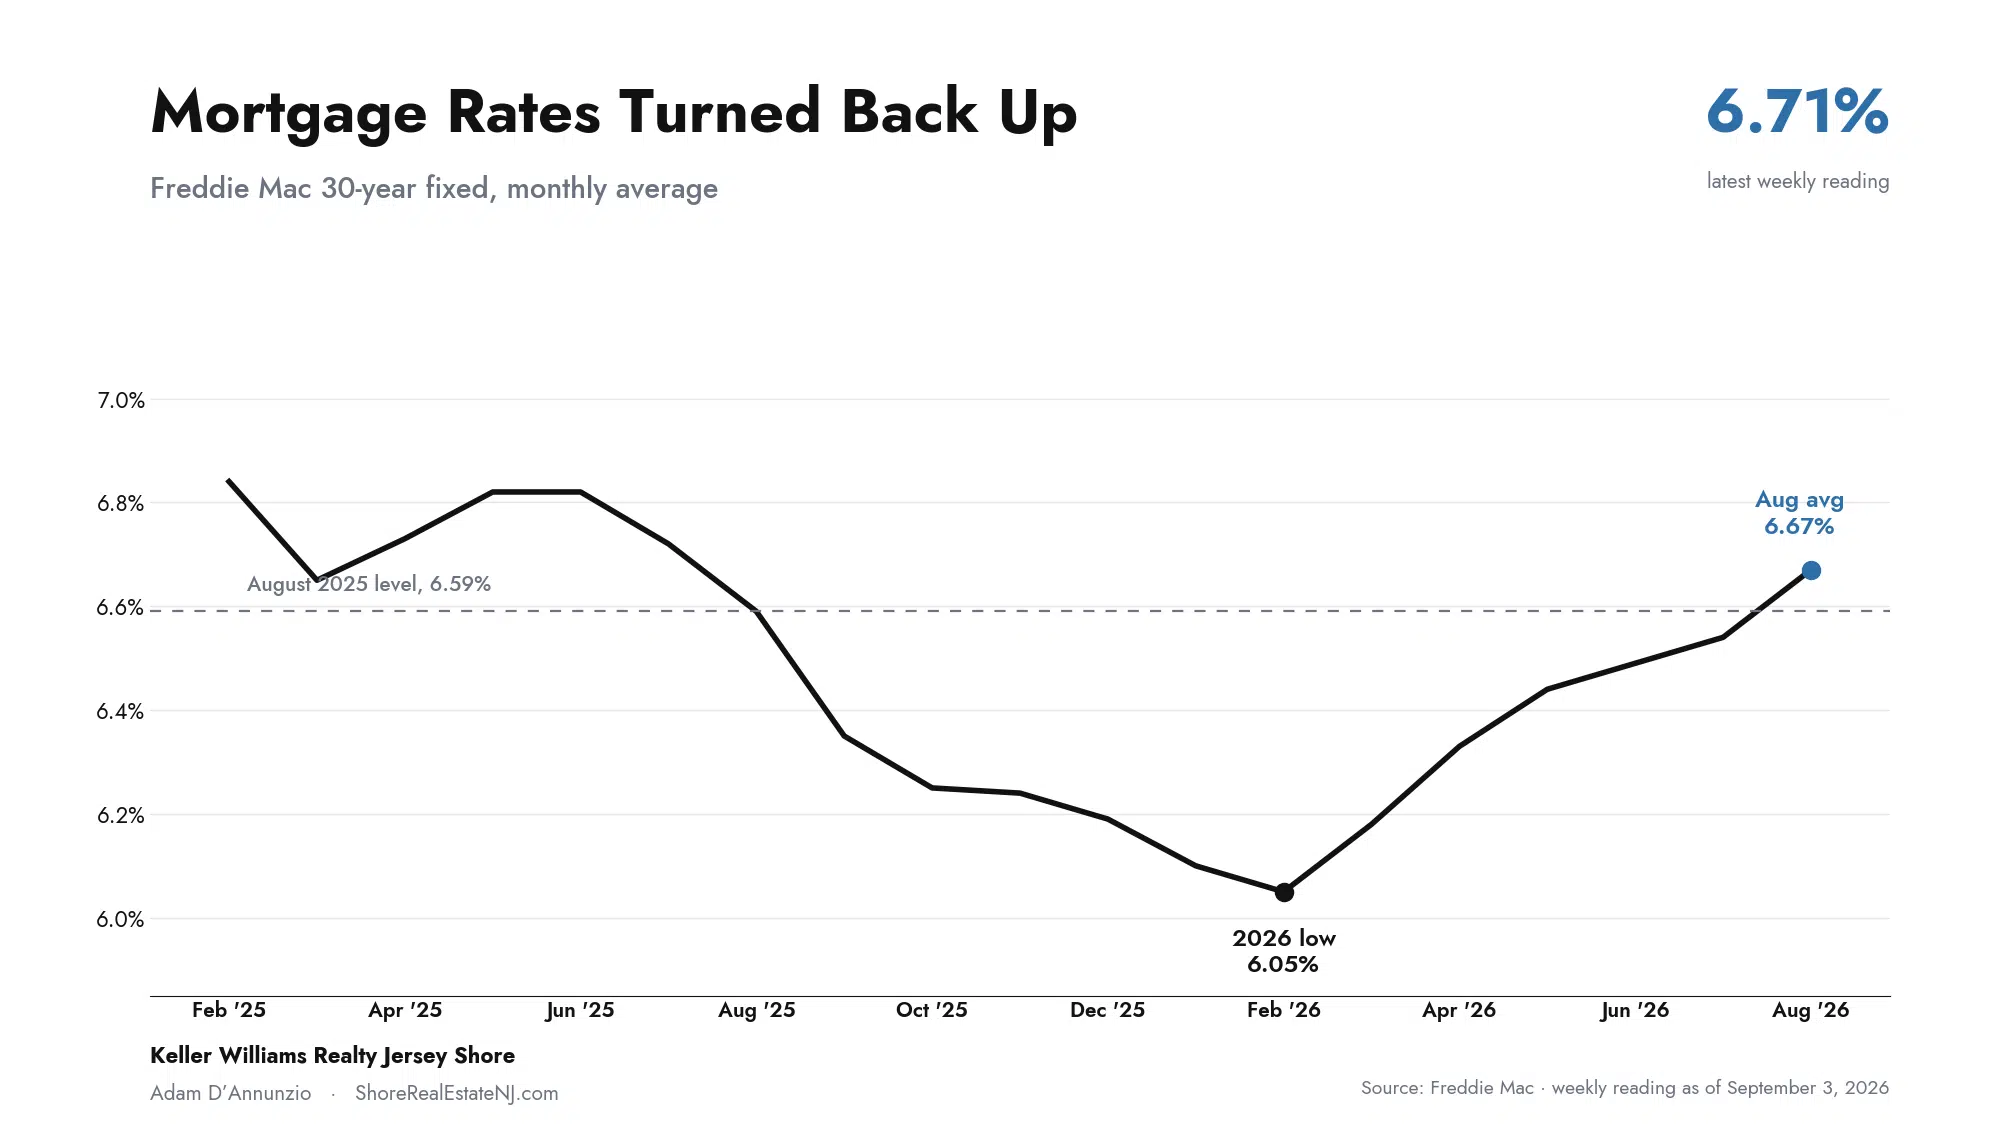
The 30-year fixed hit 6.71% last week, the highest reading of 2026. Traders are now pricing close to even odds that the Fed RAISES its benchmark rate on September 16. Not lowers it. Raises it.
National housing felt it right away. Pending sales went negative year over year for the first time since last November, ending an eight month run of growth.
The shore mostly didn't. Take the summer as a whole and closed prices here ran 3.4% ahead of last year with volume slightly up, through the first month since October 2025 that mortgage rates sat above where they were a year earlier.
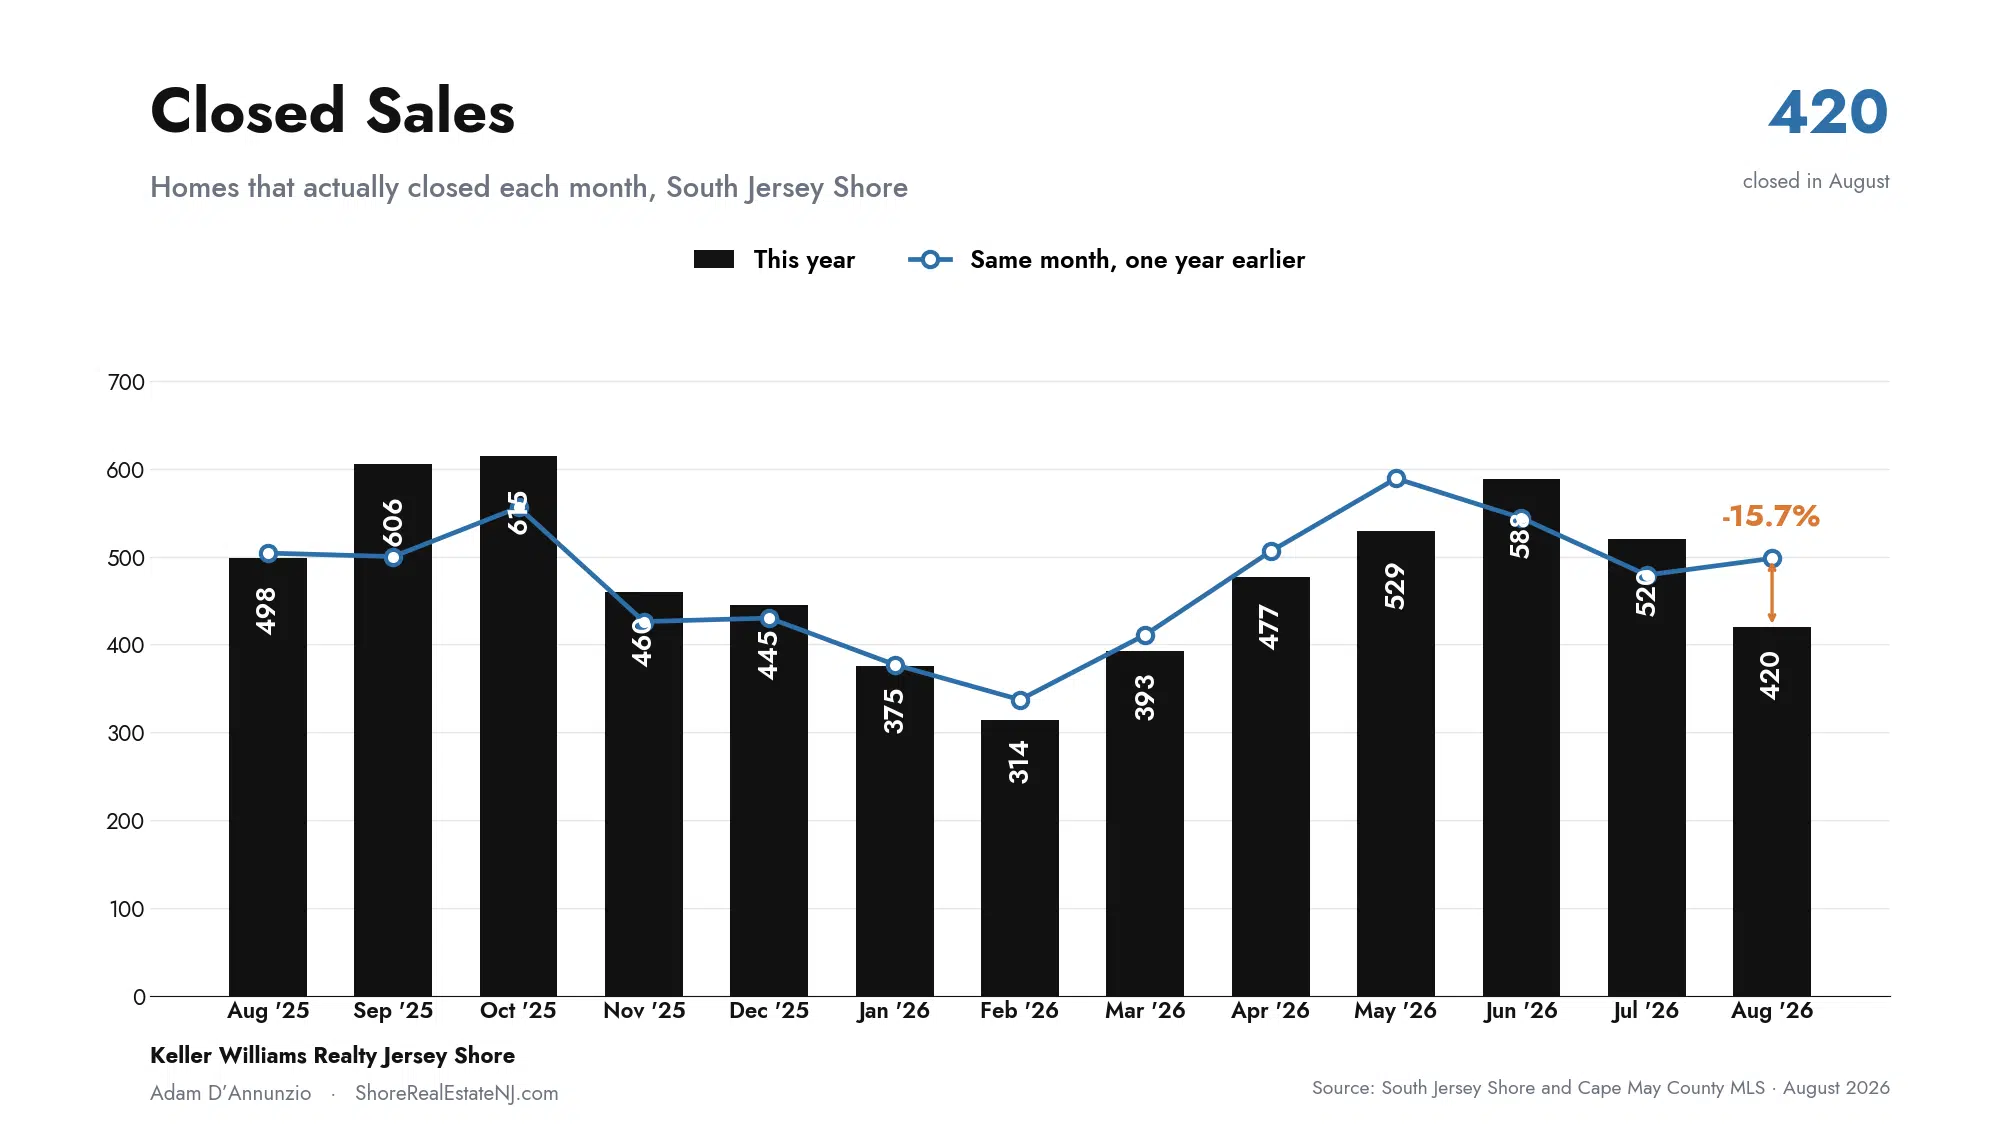
August by itself was softer. 420 closings against 498 last August. I'll show you that number and explain why I'm not ready to call it a turn.
There's also a second number in here that complicates things for sellers, and I'd rather you hear it from me than find it out during a listing appointment.
The August numbers at a glance:
Closed prices across June through August ran 3.4% above the same stretch last year. The national median list price fell for a tenth straight month.
August alone was softer, 420 sales against 498 a year ago, with late-reported closings still coming in.
Mortgage rates reached 6.71%, a 2026 high, and the September Fed meeting is now a live debate about a hike.
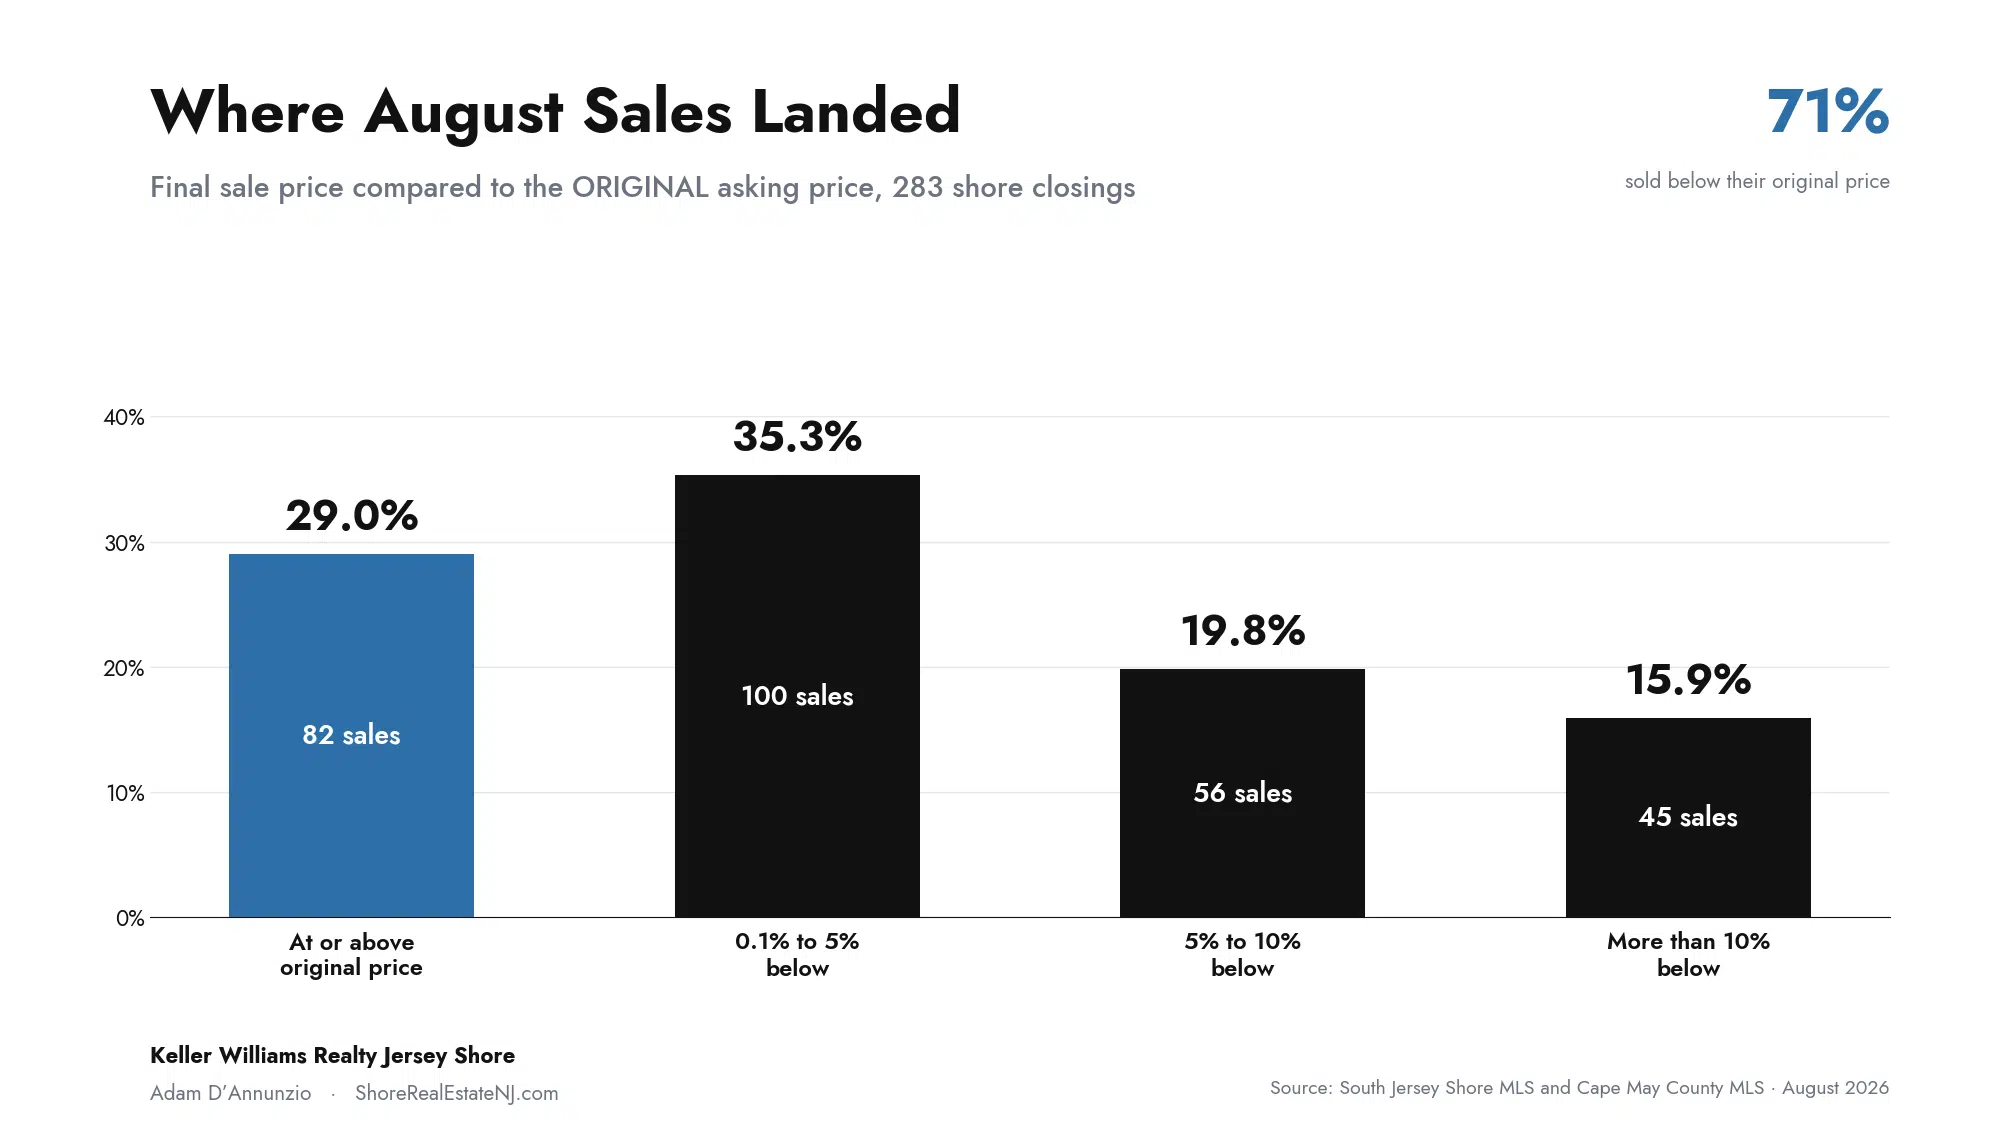
71% of the 283 shore homes that closed in August sold for less than their original asking price.
Jump to a section:
- What's happening in the national housing market
- How the South Jersey Shore market is doing
- Which shore towns are moving fastest
- Which towns have the least inventory
- Are shore home prices dropping
- Should you wait for lower mortgage rates
- Is now a good time to sell
- Is now a good time to buy
- The bottom line
What's Happening in the National Housing Market Right Now?
The rate story reversed on itself this year. The 30-year fixed bottomed at a 6.05% monthly average in February and has climbed every single month since, finishing August at 6.67% and printing 6.71% in the first week of September. August 2025 averaged 6.59%. So for the first time in ten months, buyers are looking at a rate worse than the one they passed on last year.
The cause isn't housing. It's oil. The Middle East conflict pushed Brent to roughly $94 and diesel to a record $5.85 a gallon, inflation moved back up toward the mid-3s, and the 10-year Treasury climbed past 4.75%. Mortgage rates follow the 10-year almost exactly.
Then the Fed chair spent his Jackson Hole speech saying inflation has run too high for too long. Odds of a September hike jumped toward 67%, dropped to 54.6% when Governor Waller pushed back, and swung back up to 58% after the August jobs report added 162,000 payrolls against a 53,000 forecast. That is not a rate market with a direction. That's a rate market waiting on the August inflation print.
Housing data caught up in August. The national median list price fell 1.3% year over year to $424,500, a tenth consecutive monthly decline. One in five listings took a price cut, matching last year's rate for the first time in 2026. Pending sales slipped 0.2% and new contract signings dropped 3.4%. Active inventory reached 1.14 million for the month, and the weekly count hit its highest level since November 2019. It's still about 11% below normal pre-pandemic levels.
Put plainly: nationally, more homes are for sale, they're taking longer to price correctly, and the buyers who are left are paying more to borrow.
How Is the South Jersey Shore Housing Market Doing?
Better than that, and not uniformly.
Shore-wide, closed prices across June, July and August ran 3.4% above the same three months last year, on 1,528 sales against 1,521. Sold-to-list held at 98.1%. Months of supply on the sold side finished August at 4.25, dead even with a year ago.
Now the part that needs saying out loud, because the three months don't agree with each other.
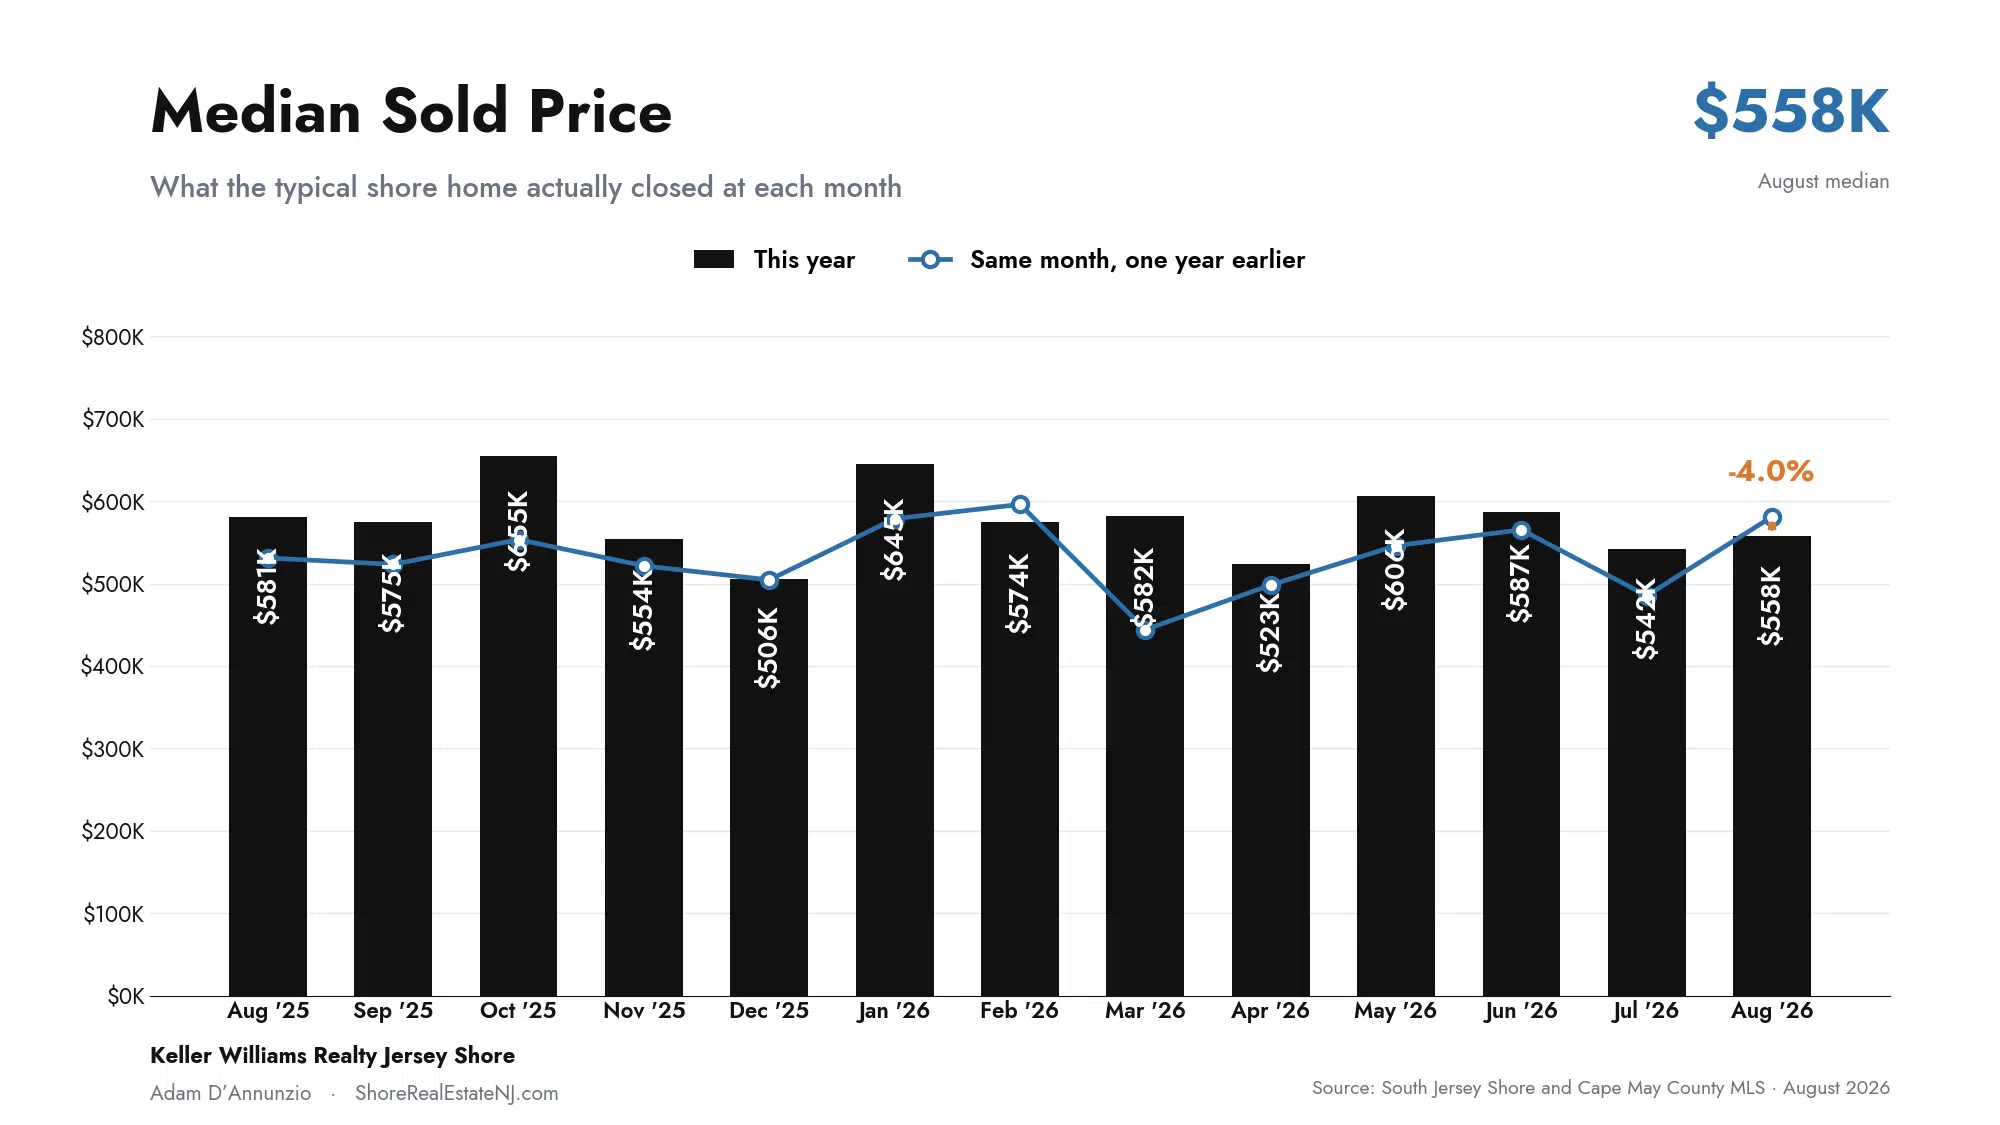
June closings ran 8.1% ahead of June 2025. July ran 8.6% ahead. August came in 15.7% behind, 420 sales against 498. The median price told the same story: up 3.8% in June, up 11.8% in July, down 4.0% in August. Two strong months and one weak one, averaged into a single reassuring number.
Before anyone panics, August closed four days before this data was pulled and late-reported closings are still landing. I expect that gap to narrow. I don't expect it to disappear. June and July are settled numbers and both were strong, so the honest read is that the summer held and August is a question mark, not a verdict. I'll know more in a few weeks.
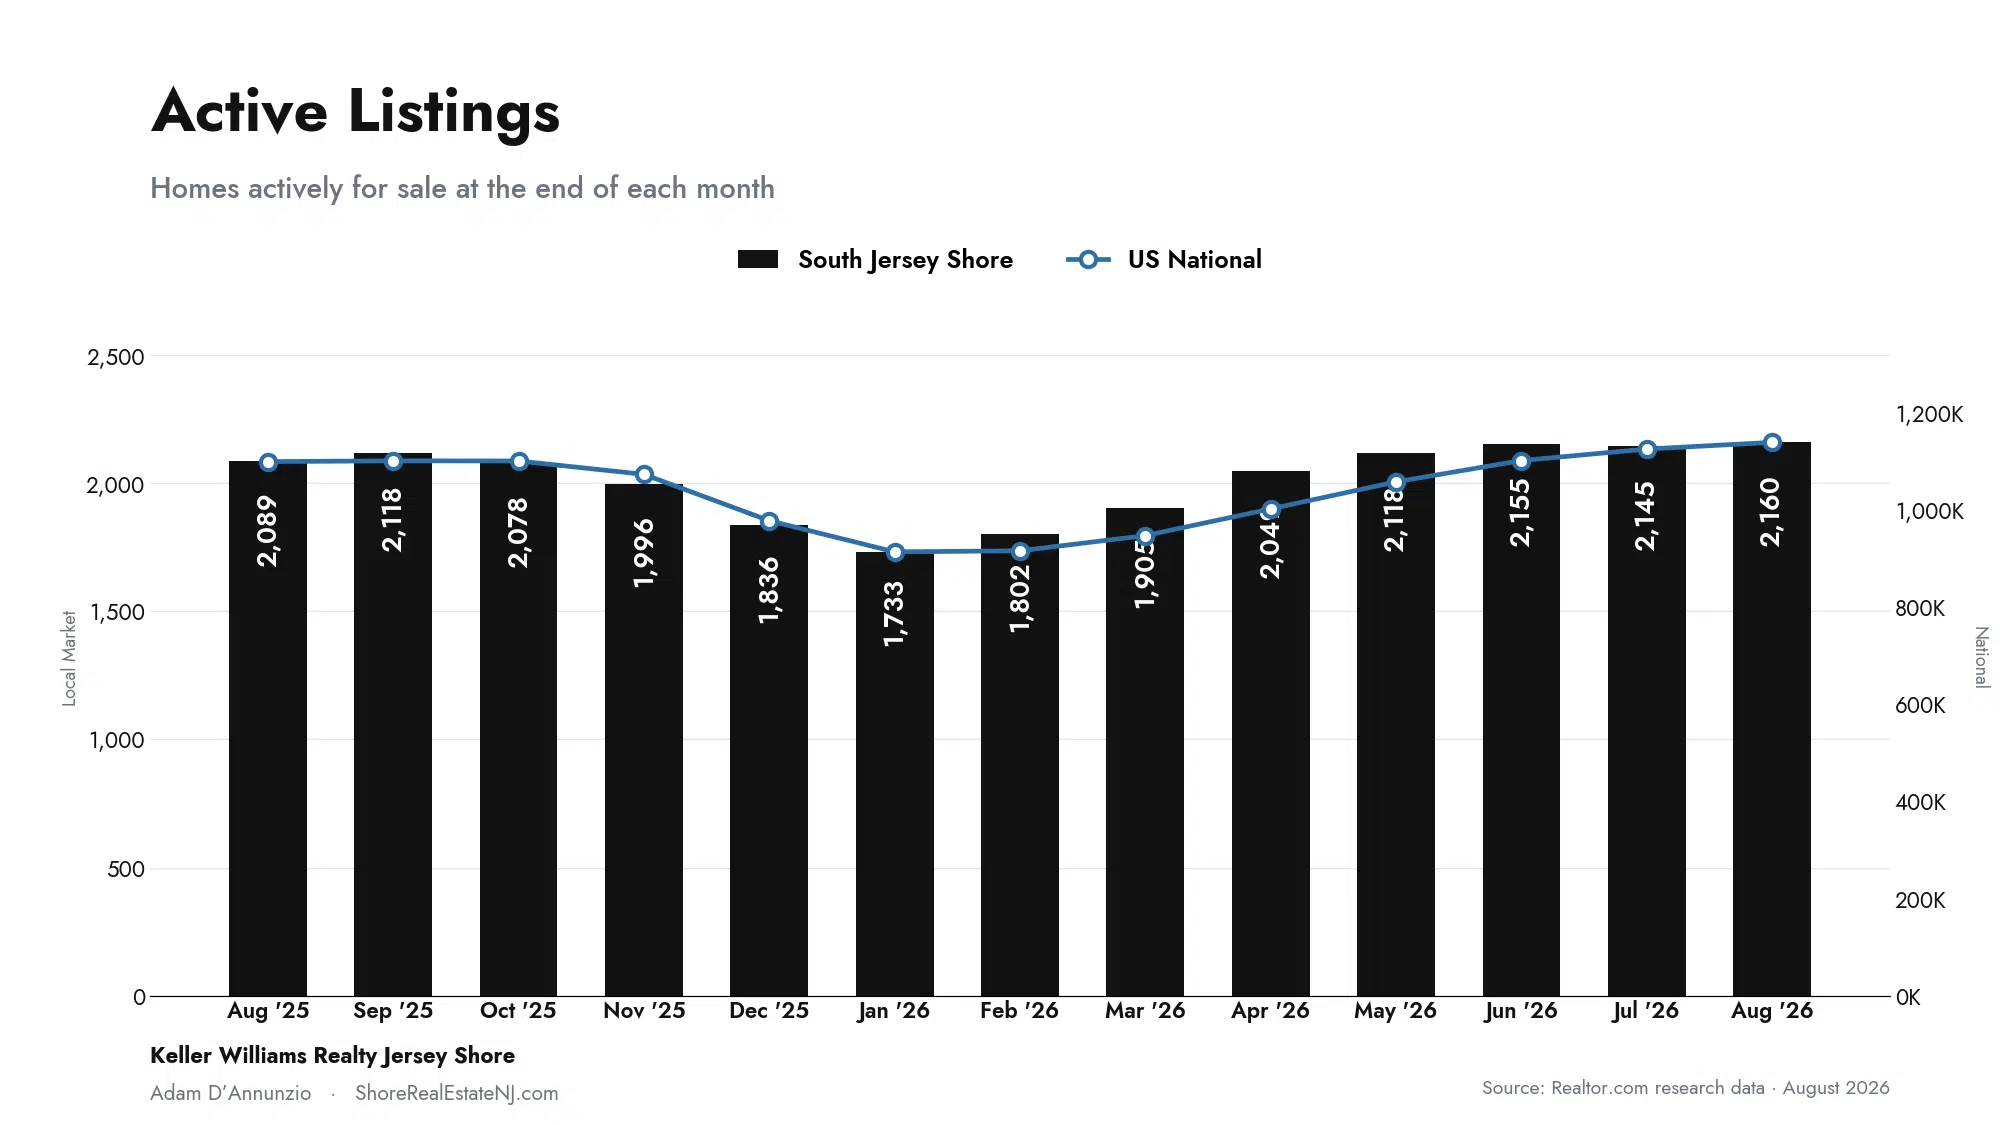
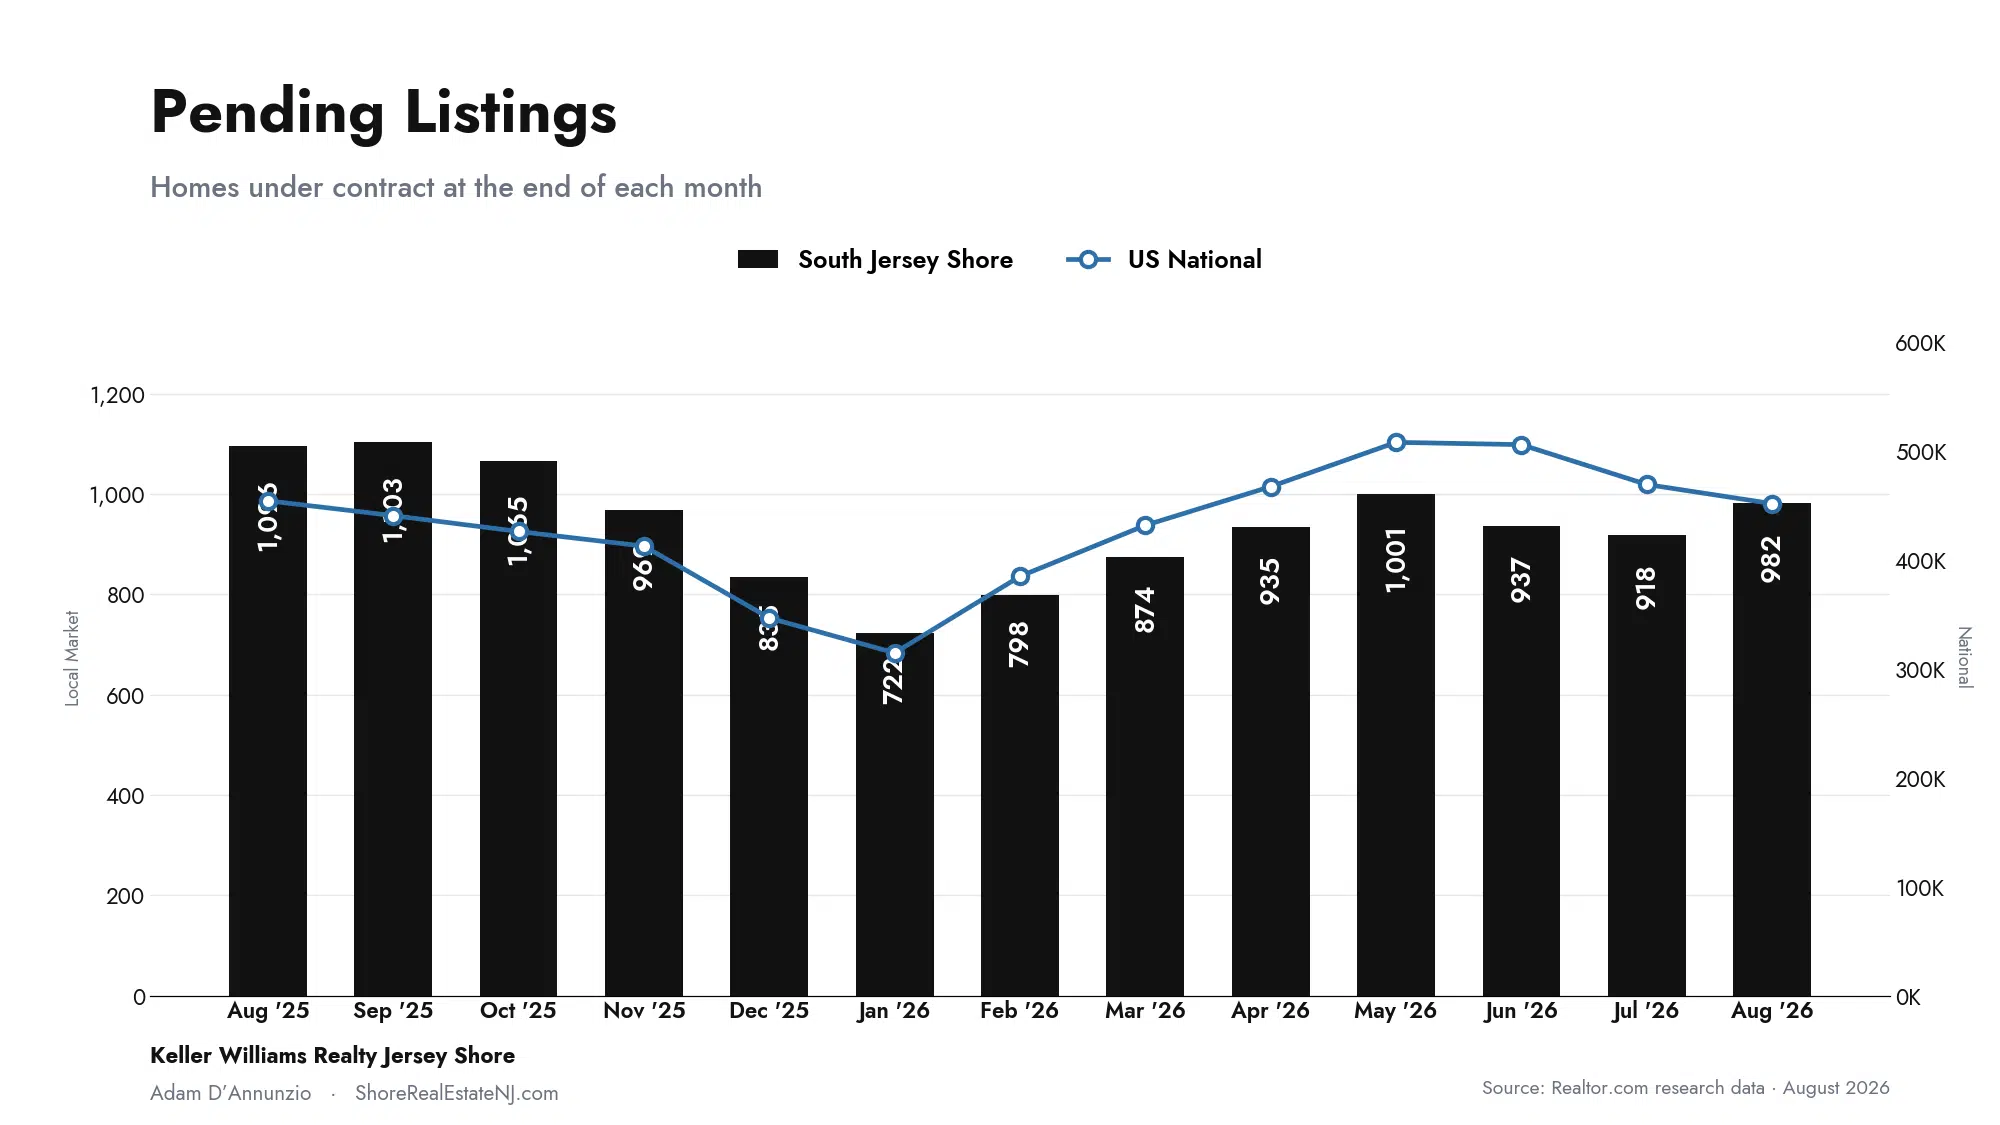
Inventory is up, but modestly. 2,160 active listings, about 2.6% more than a year ago. Nationally the same figure is climbing faster and from a much weaker starting point. Pending listings tell the more cautious story at 982, down 7.6% year over year. Fewer people are going under contract here too. They're just not getting price concessions for it yet.
The two counties are running on different tracks, and if you own on one side of the line the other side's numbers don't describe your house.
Cape May County
Less on the market, sellers holding firm
Median list price: $899,000, up 8.3% year over year
Active listings: 874, down 4.8%
Listings with a price cut: 11.3%, down 12.4%
Median sold price: $711,112, up 1.3%
Closed sales: 204, up 1.0%
Atlantic County
More choice, and prices still climbing
Median list price: $419,000, down 0.8% year over year
Active listings: 1,286, up 8.4%
Listings with a price cut: 17.7%, up 10.4%
Median sold price: $413,500, up 6.5%
Closed sales: 216, even with last year
Here's the part most people get backwards. Cape May County has less on the market and far fewer sellers cutting, but its closed prices only moved 1.3%. Atlantic County has 8% more inventory and a rising share of reductions, and its closed prices moved 6.5%. Asking-price behavior and closing-price behavior are pointing in opposite directions across the county line right now. If you're pricing off what your neighbors are asking, that's worth sitting with.
Which Shore Towns Are Moving Fastest Right Now?
Ocean City led on volume again with 34 closings at a $937,500 median, 97.6% of asking, 31 days. Its median is down 3.7% from last August and supply is flat. Steady, and slightly cheaper than a year ago.
Egg Harbor Township was right behind at 33 sales, median $465,000 up 11.7%, and 98.5% of asking in 24 days. That's the fastest pace of any town with real volume, and it happened while inventory rose 25%. More homes to pick from and they're still gone in under a month.
North Wildwood is the story of the month. 28 closings at an $887,500 median, up 63% year over year. That's the biggest price move on the board by a wide margin and it's built on plenty of transactions.
Brigantine closed 17 at $650,000 with the sharpest inventory drop anywhere, down 33%. Upper Township and Ocean View did 16 sales, median $529,500 up 20.5%, with supply down 30%.
Wildwood also closed 16, at $599,500, and got a full 100% of asking with supply down 25%. Wildwood Crest did 10 at $962,000 and 99% of asking, though its median is down 26% and inventory is up 12%.
Three towns closed at or above full asking price in August. Wildwood, Cape May City, and Cape May Court House all hit 100%. Cape May City did it on 10 sales with a median of $1,302,500, up 29%. That combination, full price and a big median jump, is the strongest single-town showing in the data.
Linwood stays the quiet standout. 12 sales, median $599,950 up 25%, 98.5% of asking, and 13 days to contract. Margate was even quicker at 12 days on 11 sales, median $859,000, though that median is down 7%.
Avalon closed 12 at a $5,087,500 median, up nearly 32%, with supply down 19%. The high end of Seven Mile is not participating in any slowdown.
Mays Landing had the most volume of any mainland town at 19 sales, but at a $264,000 median that's flat year over year, and supply there is up 52%, the largest increase anywhere. Ventnor closed 12 at $807,500, up 8%, but its 95.1% sold-to-list was the weakest on the board. Somers Point logged 9 at $490,000 with supply up 36%.
Five markets ran too thin in August to draw a conclusion from: Sea Isle City and Stone Harbor at 5 sales each, Longport at 3, Cape May Point at 2, and Strathmere with none. They're in the table below, but one closing swings those medians by six figures. Don't price off them.
Which South Jersey Shore Towns Have the Least Inventory?
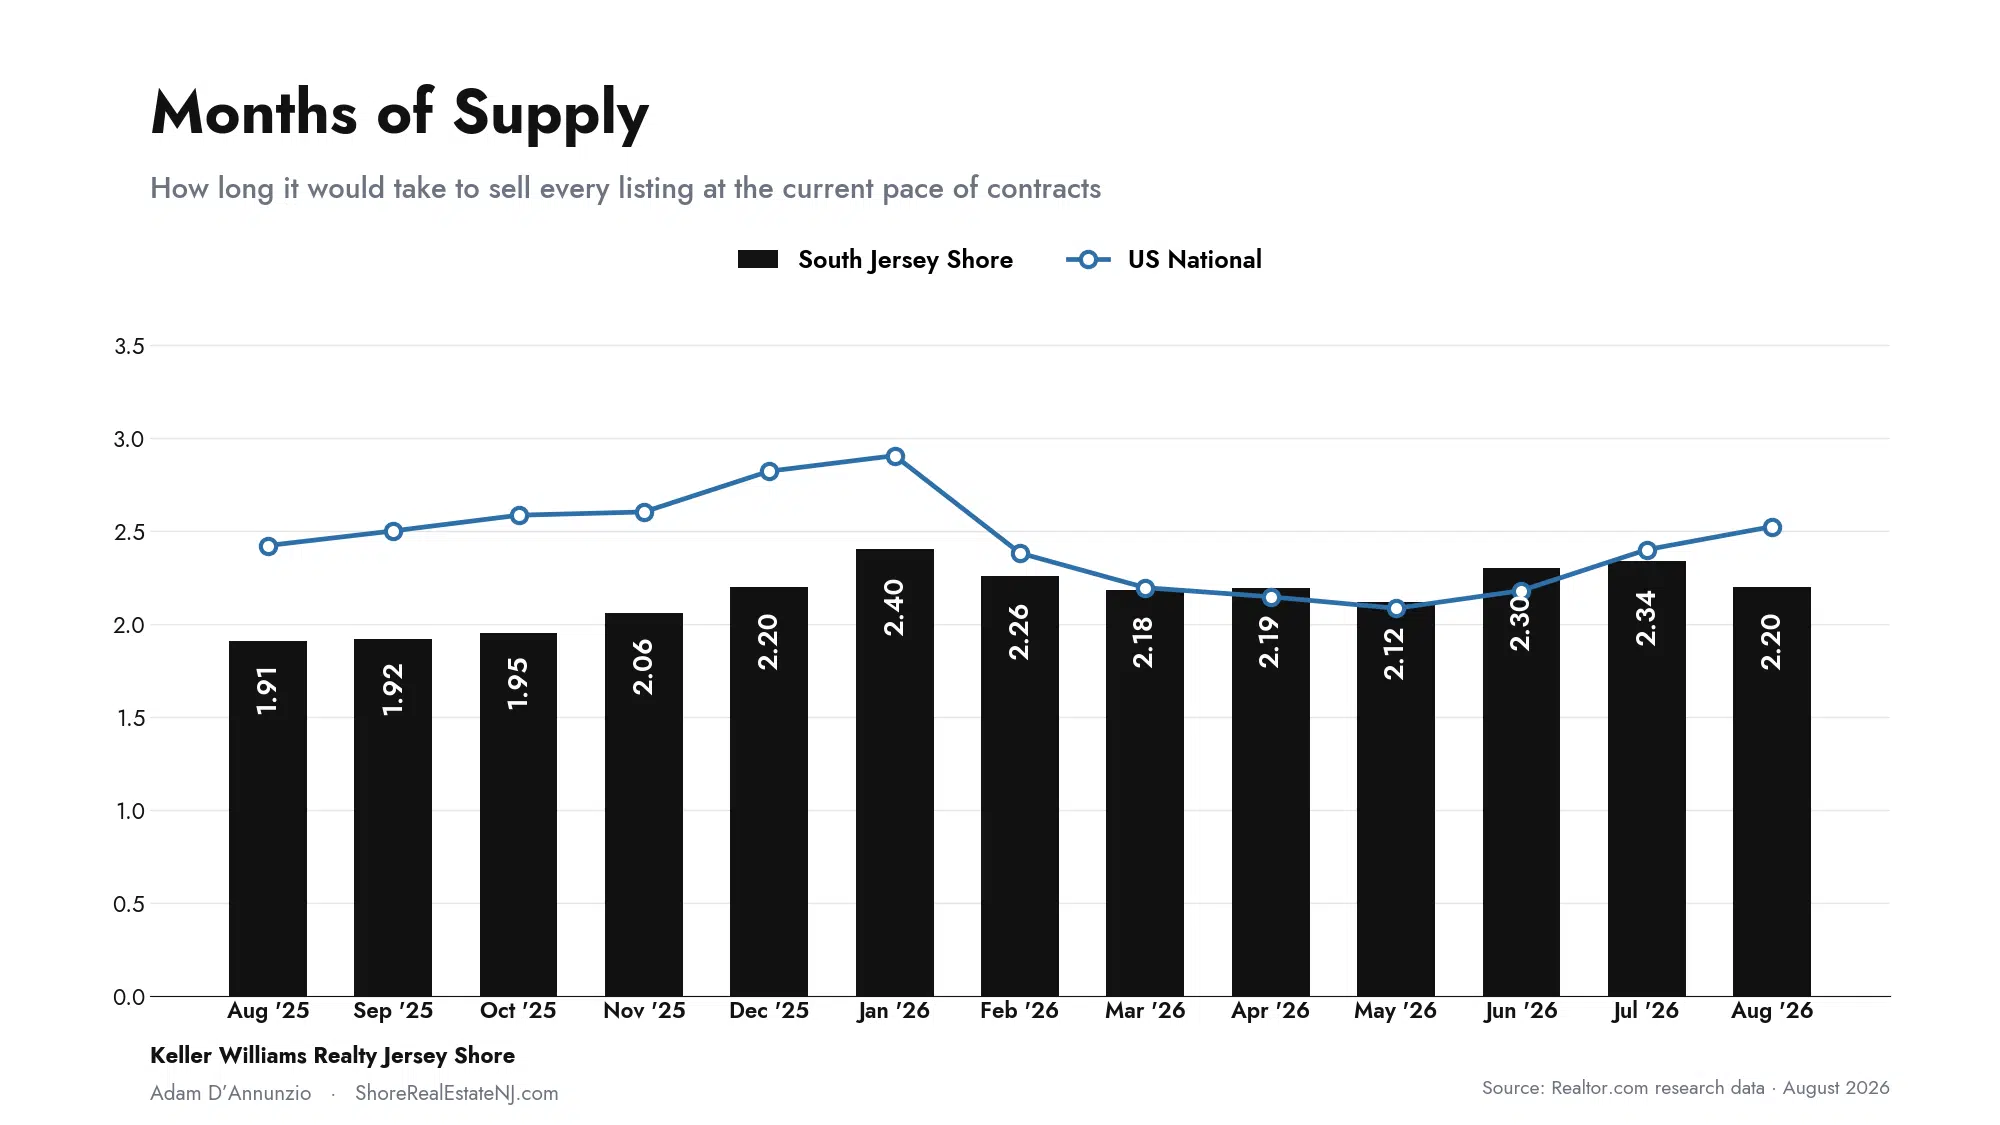
Months of supply is the number I watch first. It's how long it would take to sell everything currently listed at the pace homes are actually selling. Under about 5 months is a seller's market on the shore. Every town on this list is under 5 except four.
| Town | Months of Supply | vs. Last Year | Median Sold | Sold to List | Median Days | Sales |
|---|---|---|---|---|---|---|
| Sea Isle City * | 2.8 | -23.5% | $1,995,000 | 96.5% | 249 | 5 |
| Upper Twp & Ocean View | 3.1 | -29.9% | $529,500 | 97.3% | 44 | 16 |
| Cape May City | 3.2 | -9.3% | $1,302,500 | 100.0% | 95 | 10 |
| Egg Harbor Township | 3.2 | +24.7% | $465,000 | 98.5% | 24 | 33 |
| Brigantine | 3.3 | -32.7% | $650,000 | 96.8% | 58 | 17 |
| Wildwood | 3.4 | -24.6% | $599,500 | 100.0% | 52 | 16 |
| Avalon | 3.9 | -18.5% | $5,087,500 | 96.9% | 86 | 12 |
| Ocean City | 4.1 | -0.8% | $937,500 | 97.6% | 31 | 34 |
| Wildwood Crest | 4.2 | +11.7% | $962,000 | 99.0% | 72 | 10 |
| Cape May Point * | 4.2 | +78.8% | $1,675,000 | 93.8% | 279 | 2 |
| Somers Point | 4.3 | +35.6% | $490,000 | 97.3% | 49 | 9 |
| Strathmere * | 4.3 | +2.7% | n/a | n/a | n/a | 0 |
| Linwood | 4.4 | -17.1% | $599,950 | 98.5% | 13 | 12 |
| Margate | 4.4 | -22.3% | $859,000 | 97.4% | 12 | 11 |
| North Wildwood | 4.4 | +19.0% | $887,500 | 97.2% | 93 | 28 |
| Mays Landing | 4.8 | +52.4% | $264,000 | 99.6% | 48 | 19 |
| Ventnor | 6.0 | -2.2% | $807,500 | 95.1% | 61 | 12 |
| Cape May Court House | 6.9 | -17.4% | $669,500 | 100.0% | 87 | 10 |
| Stone Harbor * | 7.1 | +14.1% | $4,195,000 | 97.4% | 189 | 5 |
| Longport * | 12.2 | +68.1% | $1,150,000 | 98.1% | 53 | 3 |
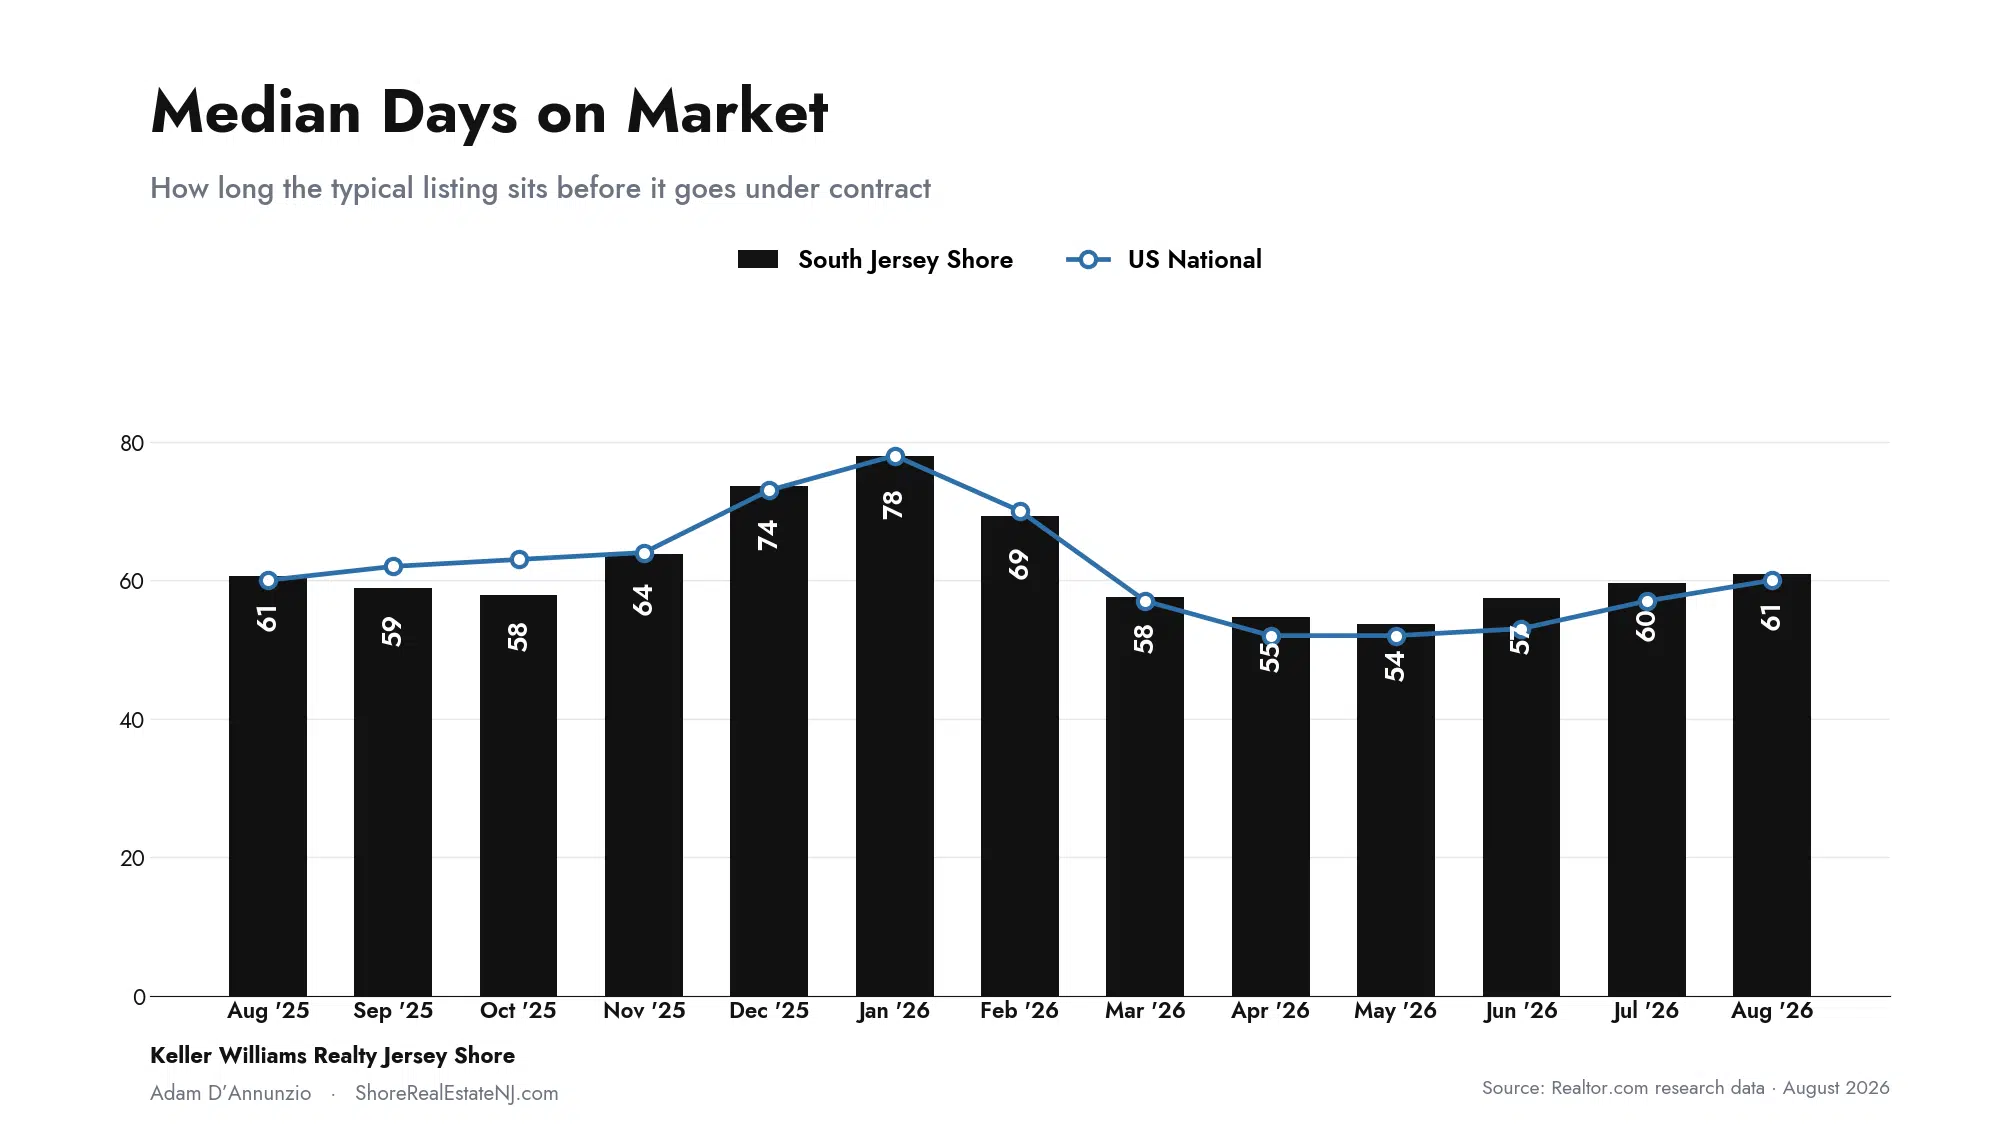
* Fewer than 6 August closings. Single-month figures for these towns swing hard and shouldn't be used for pricing. Median days on market is measured differently by county: Atlantic County MLS counts list to contract, Cape May County MLS counts list to closing, which runs roughly a month longer. Compare days within a county, not across the two. Town months of supply comes from local MLS sold data and reads higher than the chart above, which uses a national dataset built on pending contracts. Different yardsticks, same direction.
Here's the same data as change from a year ago. Blue means less inventory than last August. Orange means more. Only towns with at least 6 closings are shown.
Ten of fifteen towns have less inventory than they did a year ago. That's the single best argument against the idea that the shore is about to break.
Are Home Prices Dropping at the Jersey Shore?
Not across the summer. Shore-wide closed prices are up 3.4% over June through August. Atlantic County is up 6.5% and Cape May County is up 1.3%. August by itself came in 4.0% below last August, which is the caveat I'd attach to all of it until the month finishes reporting.
But that's the number after the negotiation. I pulled all 283 August closings across our markets and compared each sale price to what the seller originally asked, not what they were asking at the end. That comparison is where the real market lives.
Read those two top numbers together. The 98.0% is the one agents quote. The 96.9% is what actually happened, and the gap between them is the cost of getting the price wrong the first time.
On a $900,000 Ocean City condo that's roughly $28,000 of difference between pricing it right and pricing it hopefully. Not a rounding error.
The split by geography is worth knowing too. On the islands, 74% of August sellers closed below their original price, the typical sale landed at 96.6% of it, and the median home took 70 days. On the mainland, 67% sold under original, the typical sale hit 97.3%, and homes moved in 46 days. Island sellers are asking more and conceding more.
My read: prices aren't falling here, but pricing power has narrowed to sellers who get it right on day one. That's a different market than 2021 and it's a different market than the panic some national headlines are selling.
Should I Wait for Lower Mortgage Rates to Buy a Shore House?
I can't tell you where rates are going and neither can anyone quoting a forecast at you right now. In one week the market's odds of a September Fed hike went 67%, then 54.6%, then 49.4%, then 58%. That's not a forecast. That's a market with no idea, repricing on every headline.
What I can tell you is that waiting has cost money at the shore for four straight years, and this market has never behaved like a rate-driven market.
Roughly speaking, a large share of what trades on these islands is second homes and condos bought by people who can pay cash or put down half. When the 30-year goes from 6.1% to 6.7%, a first-time buyer in Ohio loses buying power. A retired CPA buying a $5 million place in Avalon adjusts his down payment and moves on. That's why the shore spent the whole summer running ahead of last year while the national market was flattening out.
The more useful question isn't where rates go. It's whether the specific house you want will be there when they get there. Ten of our fifteen active towns have less inventory than a year ago. In Brigantine it's 33% less.
If a hike lands on September 16 and rates push through 7%, my honest expectation is that the mainland towns feel it first, the islands feel it late and lightly, and the sellers who priced 5% high in July are the ones who take the hit.
Is Now a Good Time to Sell a Shore Property?
Yes, with a condition attached, and the condition is the whole thing.
The case for selling: closed prices are above last year in both counties, ten of fifteen towns are carrying less inventory than a year ago, and September through November is when shore competition thins out. The best time to sell is when there's the least competition, and that window is opening now.
The condition: 71% of August sellers did not get their original price. Almost 16% closed more than 10% below it. Those sellers didn't lose money because the market turned on them. They lost it because the first list price was a guess, the market ignored it for a month, and every reduction after that negotiated against them.
If you're selling this fall, the two numbers that matter for your house are how many months of supply your town is carrying and what similar homes actually closed at, not listed at. In Margate at 4.4 months and 12 median days, you have room to be firm. In Mays Landing with supply up 52%, you don't.
Delistings nationally are running nearly 13% below last year, which tells me sellers are being more realistic on price than they were in 2025 rather than pulling homes off in frustration. I'd rather you be in that group on purpose.
Is It a Good Time to Buy a Shore House in New Jersey?
Better than it looks from the rate headline, and here's the specific reason.
Nationally, one in five listings has taken a price cut and pending sales just went negative. Locally, 71% of what closed in August closed under its original price and the typical sale gave up 3.1% from that number. Sellers are moving. That's leverage, and it's leverage that didn't exist in this market three years ago.
Where the opportunity is concentrated right now: Mays Landing with supply up 52%, Somers Point up 36%, Egg Harbor Township up 25%, and North Wildwood up 19%. More inventory means more room to negotiate, and in Egg Harbor Township you're still buying into a market that closes in 24 days, so the homes are good, there are simply more of them.
Where you won't get much: Brigantine, Upper Township, Wildwood, and Margate all shed a fifth to a third of their inventory this year. Wildwood, Cape May City, and Cape May Court House sellers got 100% of asking in August. Bring your best offer or skip it.
One practical note on financing. If you're borrowing and you find the right place this fall, look hard at whether the seller will buy the rate down instead of cutting the price. In a market where 71% of sellers are already conceding something, a rate buydown often costs the seller less than the price reduction they were going to make anyway, and it saves you more.
The Bottom Line
August was the month the national housing market finally reacted to a year of rising rates. The shore spent the summer ignoring it, and August is the first month where that's an open question rather than a settled one.
Closed prices across the summer are up 3.4%, sold-to-list is holding at 98.1%, and two thirds of our towns are carrying less inventory than last year. That's real, and it isn't luck. It's what a market built on second homes and cash buyers looks like when borrowing costs go up. August's sales count came in under last August, and I'll know in a few weeks how much of that was late reporting versus a genuine cooling.
The part I'd want you to take seriously is the 71%. The shore is holding value, and almost three out of four sellers still had to come down off their original number to capture it. Those two facts aren't in conflict. They're the same fact viewed from either side of a listing agreement.
September's Fed meeting on the 16th and the August inflation report a few days before it will set the tone for the rest of the year. I'll have the numbers either way.
If you're thinking about buying or selling in the next six months and you want to know what your specific town and price point are actually doing, reach out. I'd rather give you the honest read than a headline.
Local Market Guides
Browse the Market by Town
Market data, listings, and local knowledge for every shore town in Cape May and Atlantic Counties.
Adam D'Annunzio is a Broker Associate with Keller Williams Realty Jersey Shore and has worked exclusively in the South Jersey Shore market since 2012, specializing in waterfront properties, second homes, and condos from Brigantine and Margate through Ocean City, Sea Isle City, Avalon, Stone Harbor, The Wildwoods, and Cape May. Questions about your town or your property? Call or text 609-604-5958, or get in touch here.