
Shore Contracts Fell 23% in September as Rates Crossed 7%
September data for Cape May and Atlantic Counties · By Adam D'Annunzio, Broker Associate443 homes went under contract at the South Jersey Shore in September, across Cape May and Atlantic Counties. Last September it was 576. That's a 23% drop, the steepest year-over-year decline in contracts since January 2023.
It's also the month the 30-year fixed went back over 7% for the first time since January 2025, and the Fed raised its benchmark rate for the first time since 2023. Prices haven't followed yet. Most of what closed in September was negotiated over the summer, before rates jumped. Contracts move first.
September 2026 data, pulled October 5. The September contract count can tick up a little as late entries post.
What's Happening in the National Housing Market Right Now?
Nationally, homes under contract were down 4.1% from a year ago. Active listings rose 5.4% to about 1.16 million, and 20.8% of listings took a price cut in September, the highest share for any month since October 2022.
The national median list price was $419,250, down 1.4% from last year and the 11th straight month of year-over-year declines. The sold side is holding up better: the national median existing-home sale price in August was $429,100, up 1.6% from a year earlier. Jobs didn't help. September payrolls rose just 29,000 against expectations of 84,000.
Why Are Mortgage Rates Going Up Again?
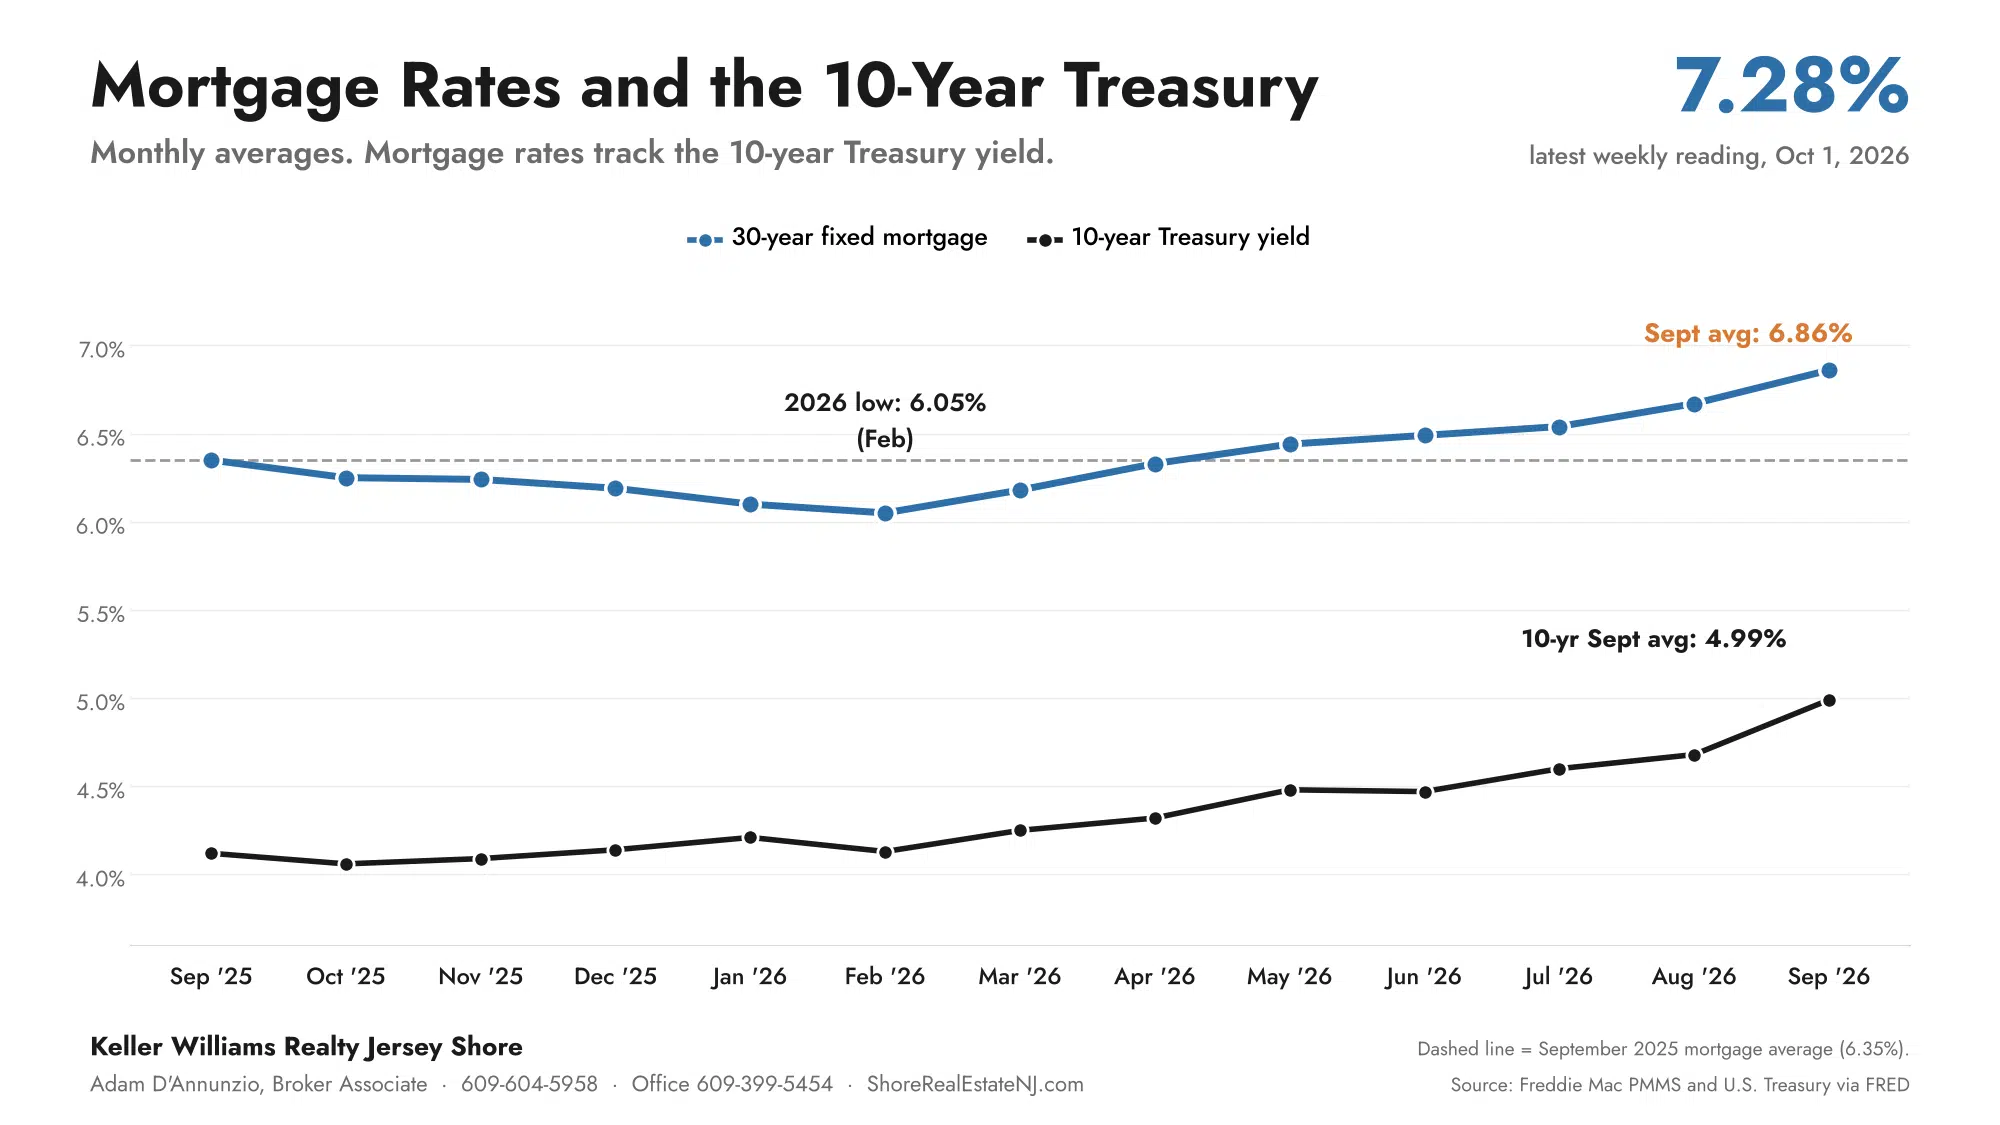
The 30-year fixed has gone up every month since February, from a 6.05% average in February to 6.86% in September. The weekly reading hit 7.28% on October 1. A year ago rates averaged 6.35%, and they were falling.
Mortgage rates follow the 10-year Treasury more than the Fed. The 10-year averaged 4.99% in September, up from 4.12% a year ago, and reached 5.24% on October 1. Behind it: consumer prices up 3.4% year over year in August, driven in part by higher energy prices, plus heavy government borrowing. Rates are up more than a full point since the Iran war started in late February.
The Fed raised its benchmark rate a quarter point on September 16, to 3.75% to 4.00%. For the October 28 meeting, futures markets price a 76% chance of no change and a 24% chance of another hike (CME FedWatch, October 5).
How Is the South Jersey Shore Housing Market Doing?
The shore closed 567 sales in September, down 6.7% from 608. The bigger move was in contracts: 443 homes went under contract against 576 a year ago.
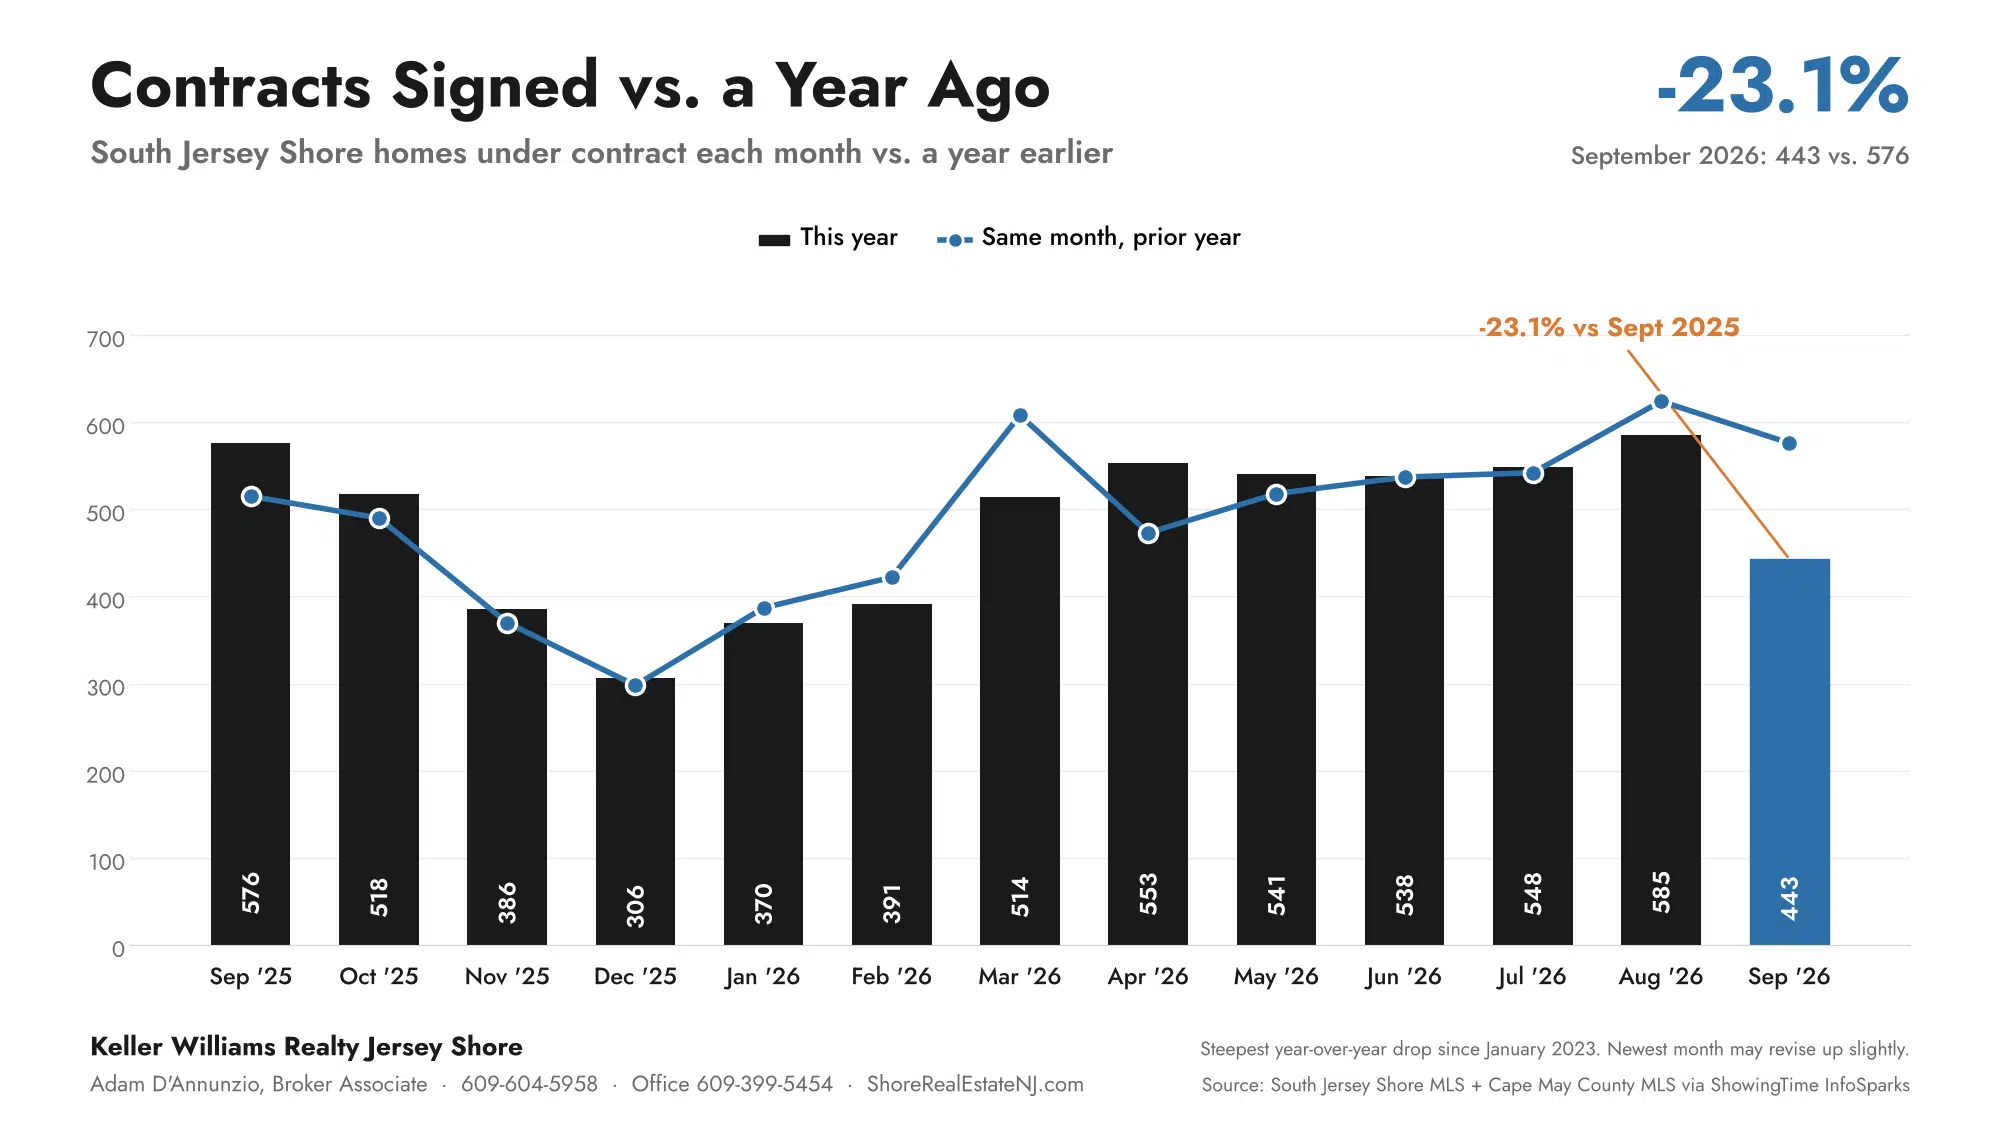
Smoothed across July through September, contracts are down 9.5%, and that smoothing hides the turn. Month by month, July was up 1.1% (548 vs. 542), August was down 6.3% (585 vs. 624) and September was down 23.1% (443 vs. 576). That tracks the rates: 6.54% in July, 6.67% in August, 6.86% in September.
Naturally, the newest month comes with a caveat. Some contracts get entered late, so the September count will likely tick up a little. It would have to rise 30% to match last September. I also checked it against the individual listings: 297 homes in the 19 shore towns below show a September contract date, against 298 in the data.
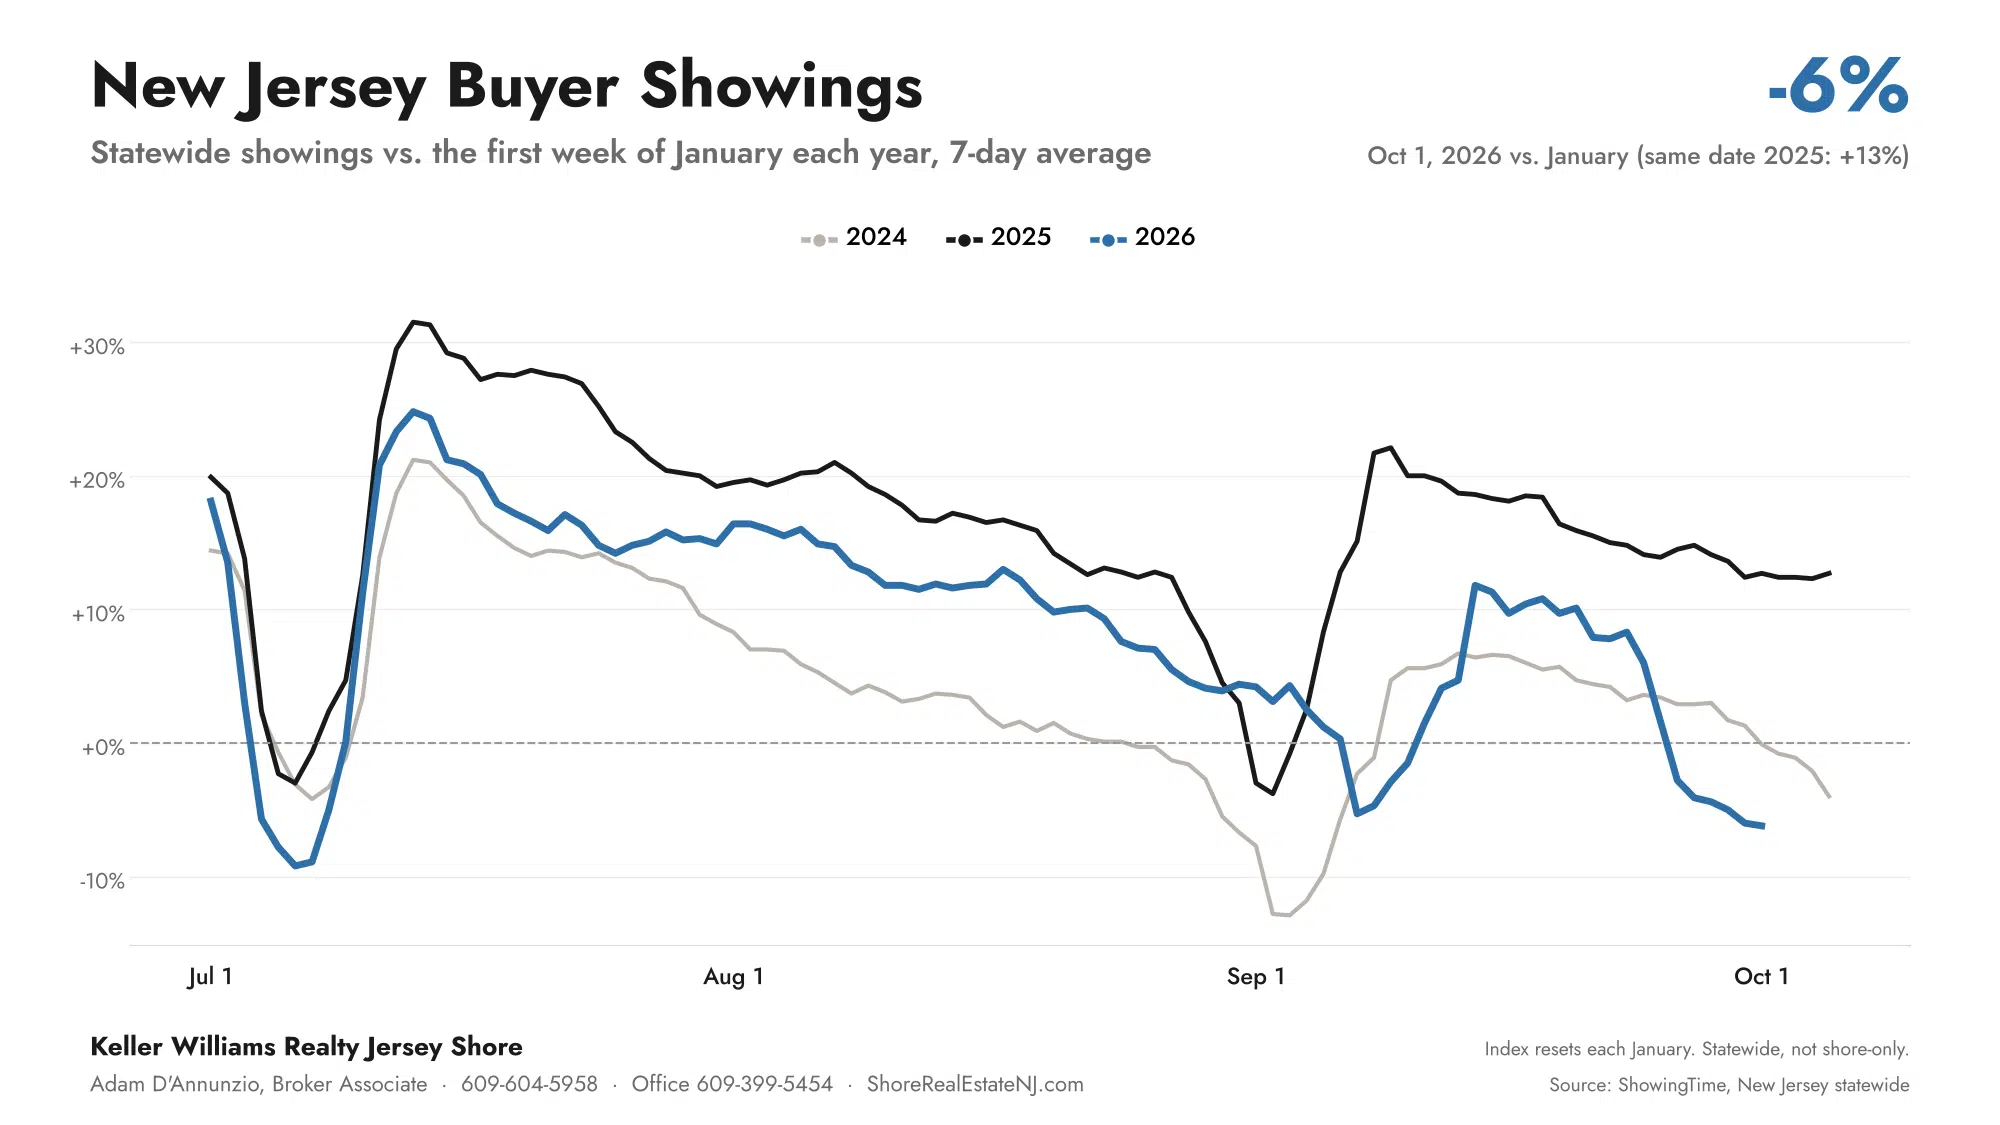
Buyer showings across New Jersey point the same way. Measured against where each year starts in January, they averaged about 3% above the January level in September, versus 14% above last September. By October 1 they were 6% below January.
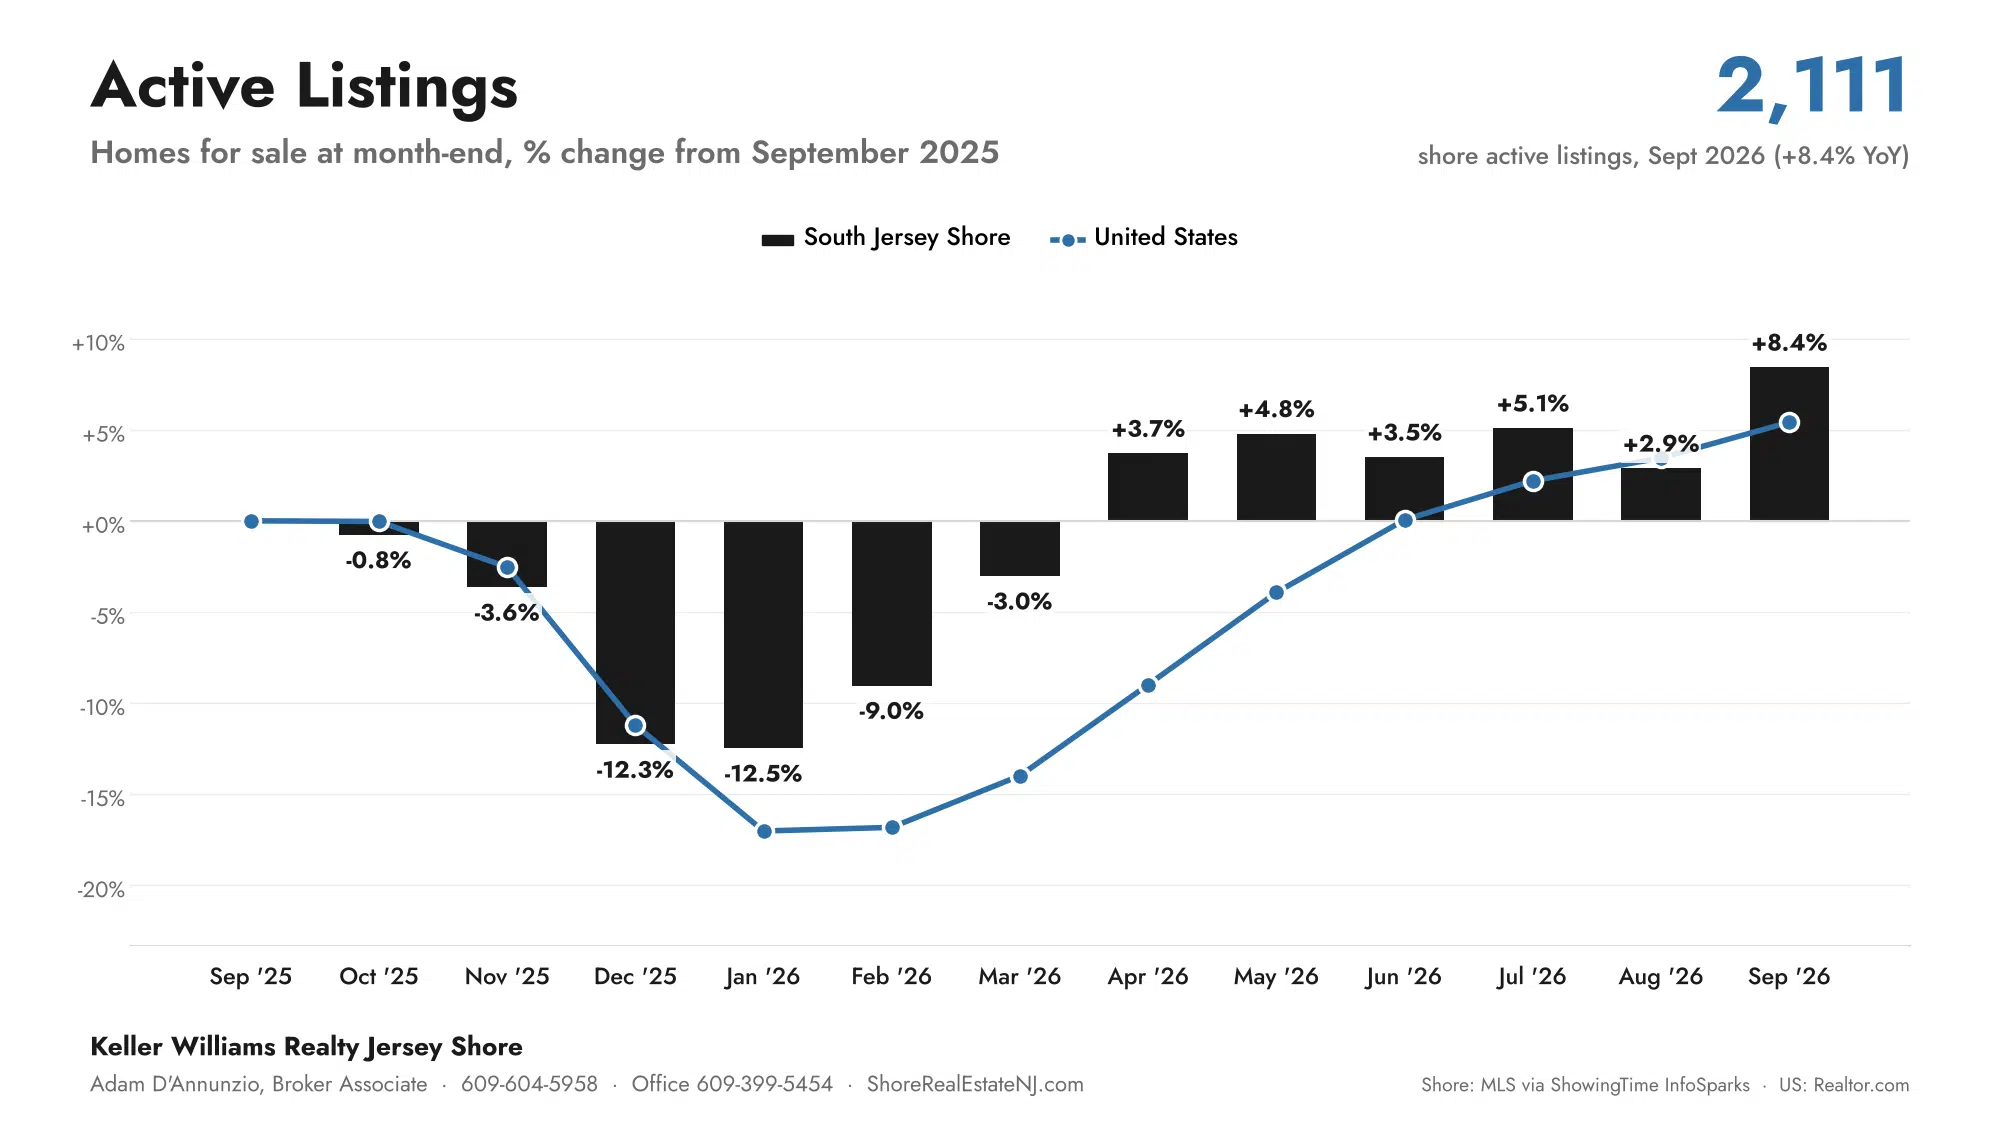
Supply is building from the other side. There were 2,111 homes for sale at the end of September, the most for any September since 2020. New listings actually fell, 777 against 827. Inventory isn't rising because more owners are listing. It's rising because fewer homes are selling. Months of supply reached 4.4, the highest September reading since 2019, which puts the shore in balanced territory (4 to 6 months).
Atlantic County
Median sold: $430,000 (vs. $395,000)
Contracts: 204 (vs. 288)
Closed sales: 287 (vs. 325)
Months of supply: 4.7 (vs. 4.1)
Cape May County
Median sold: about $840K (vs. about $785K)
Contracts: 239 (vs. 288)
Closed sales: 280 (vs. 283)
Months of supply: 4.2 (vs. 3.9)
Cape May County includes Ocean City and Upper Twp; its median is a blend of two systems weighted by sales.
Atlantic County took the bigger hit. Its 204 contracts are the fewest in any September since 2011. Cape May County closings were even with last year.
Which Shore Towns Are Moving Fastest Right Now?
The Wildwoods went under contract on 68 homes, up from 57, with North Wildwood at 26 against 18 and Wildwood Crest at 18 against 13. They also closed 78 sales at a median of $700,000, up from $627,450.
Ocean City went the other way: 48 contracts versus 69, down 30%. Closings held at 68 at a median of $1,235,000, and homes that sold went under contract in a median 14 days. Egg Harbor Township went from 53 contracts to 31 but is still a seller's market at 3.1 months.
Ventnor (6.4 months) and Stone Harbor (6.8 months) are the two towns with real volume above 6 months, which is buyer's market territory. Brigantine, Linwood and Margate all have less supply than a year ago. Somers Point (55 homes for sale vs. 31) and Mays Landing (107 vs. 73) picked up a lot of inventory.
Which South Jersey Shore Towns Have the Least Inventory?
Seller's under 4 months Balanced 4 to 6 Buyer's over 6
* Fewer than 6 closings in September; treat single-month figures as noise. The Wildwoods covers Wildwood, North Wildwood, Wildwood Crest, West Wildwood and Diamond Beach. Single family, condo and townhouse (plus twins in Cape May County). Shore-wide: 4.4 months, 567 closed, 2,111 for sale.
Are Home Prices Dropping at the Jersey Shore?
July through September prices are running about 4% ahead of the same three months last year, and Atlantic County's median is $430,000, up from $395,000. The typical sale closed at 98.2% of final asking price.
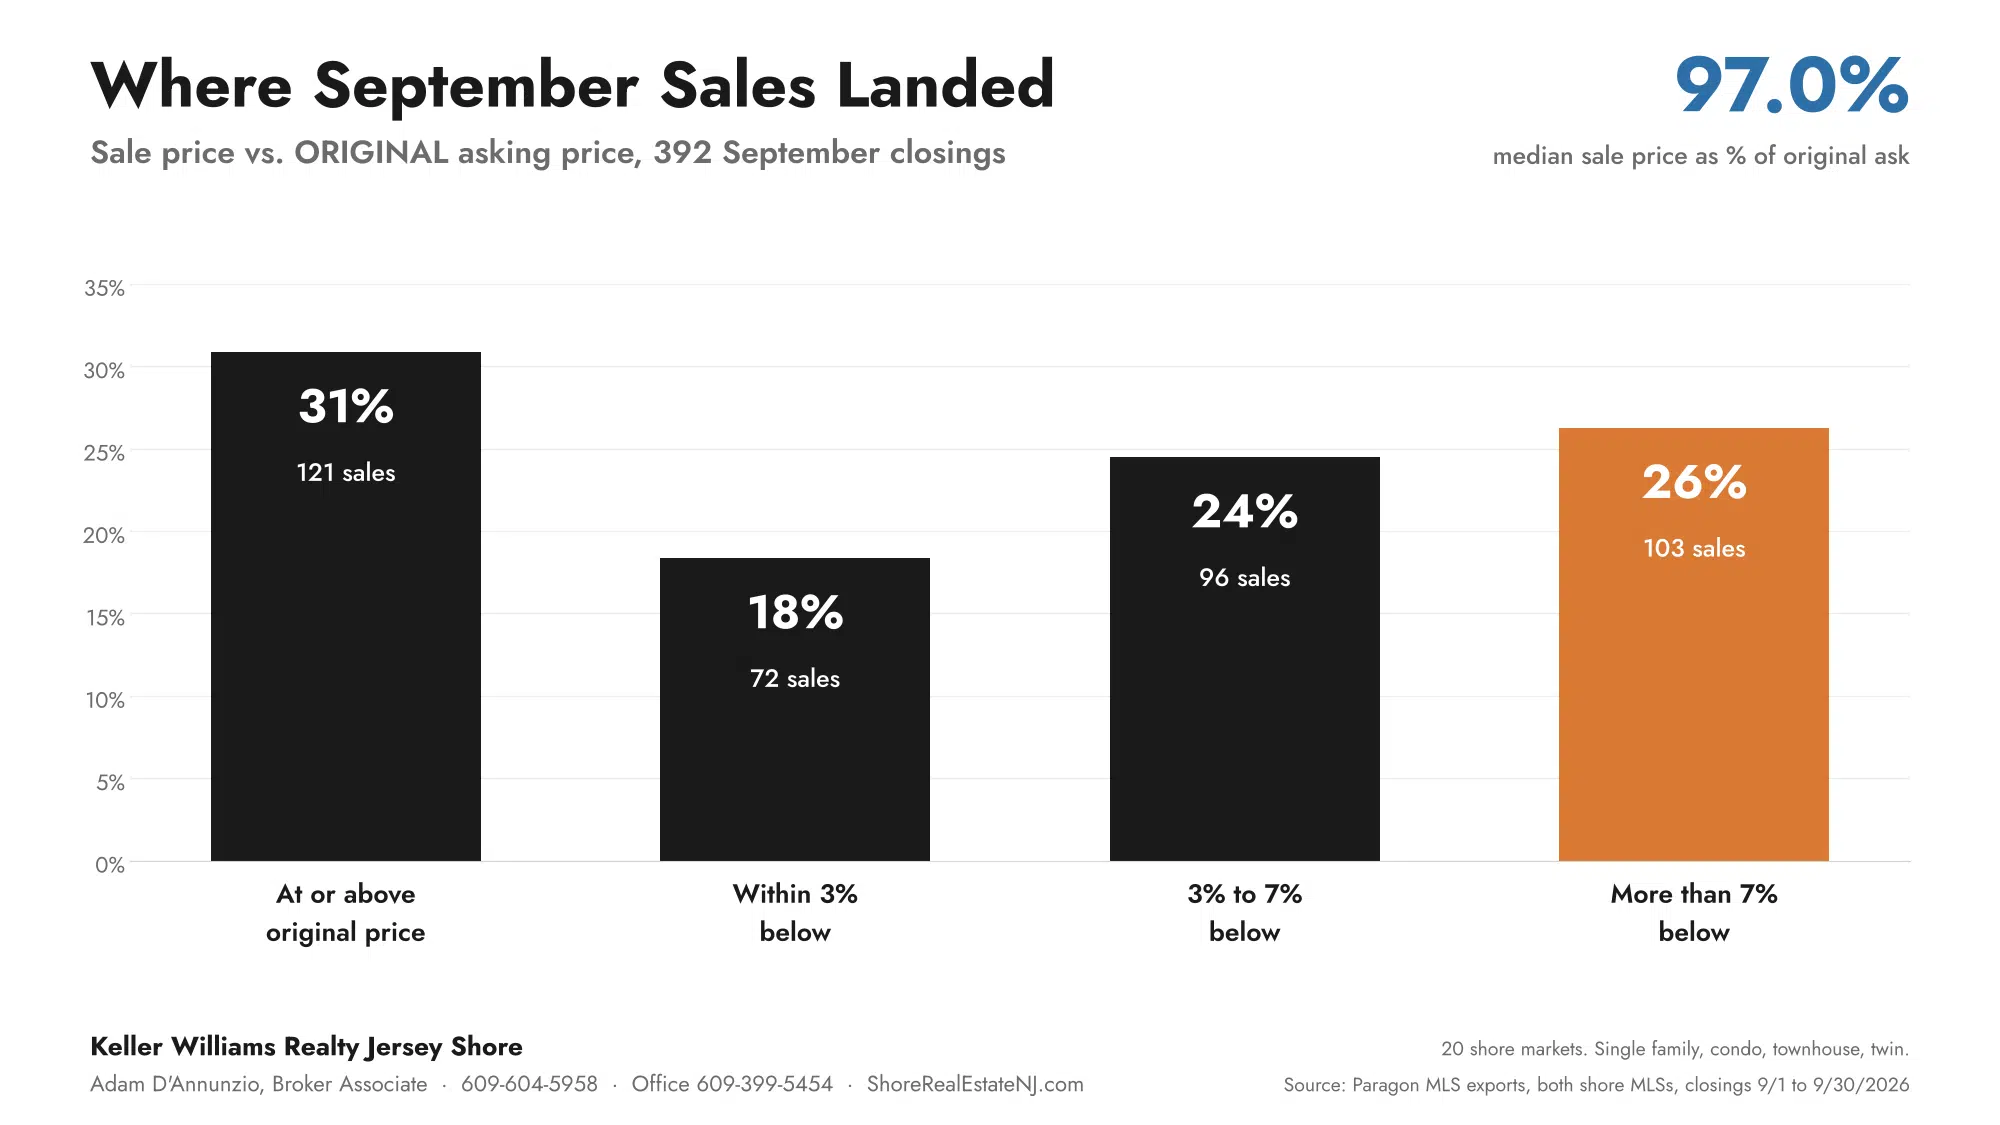
Against the original asking price it's a different picture. I pulled every September closing in the shore towns I cover, 392 sales. The typical home sold for 97.0% of its original price, and 69% sold below it.
Never cut the price
Cut the price
The price cut didn't cost those sellers money. The starting price did. On an island home listed at $975,000, about the median for the island towns in September, that's roughly $960,000 priced right versus $884,000 after a cut, a $76,000 difference.
Should I Wait for Lower Mortgage Rates to Buy a Shore House?
On a $700,000 house with 20% down, principal and interest on a $560,000 loan:
That's $233 a month more than five weeks earlier, for the same house. That being said, there are more homes for sale than any September since 2020 and fewer buyers going after them. If rates come down, the buyers who sat out September come back at the same time you do. In my professional opinion, buy when the right house and the numbers line up, and refinance if rates give you the opening. More on the outlook in where mortgage rates are headed in 2026 and 2027.
Is Now a Good Time to Sell a Shore Property?
- Price it right on day one. Homes that never cut went under contract in 12 days at 98.8% of their original price.
- Expect fewer buyers this fall. Showings are running below last year, and my read is that October and November closings will come in below last year too.
- Price against today's competition, not what a neighbor got in July, especially in towns with more supply than a year ago, like Ventnor, Somers Point, Mays Landing and Ocean City.
Is It a Good Time to Buy a Shore House in New Jersey?
- More choice. 2,111 homes for sale, up 8.4%.
- More room to negotiate. 69% of September sales closed below their original asking price.
- The good ones still go fast. The room is on homes that have been sitting, not the ones that just hit the market.
The Bottom Line
September was the month rates crossed 7% and shore buyers stepped back. Contracts fell 23%, inventory is the highest for a September since 2020, and supply is at 4.4 months. Prices haven't followed yet. October and November will show whether that holds.
The live numbers for every town are on my market dashboard, and past updates are in the monthly market report archive.
Latest Numbers by Town
Browse the Market by Town
Every town page has live market data, updated daily. Pick yours.
Adam D'Annunzio is a Broker Associate with Keller Williams Realty Jersey Shore and has worked exclusively in the South Jersey Shore market since 2012, specializing in waterfront properties, second homes, and condos from Brigantine and Margate through Ocean City, Sea Isle City, Avalon, Stone Harbor, The Wildwoods, and Cape May.